Funding Atlas 2018
Key Figures Relating to Publicly Funded Research in Germany
Tables
- Table 3-1: Participation in DFG, federal government and EU funding programmes for research by type of institutio
- Table 3-2: Number of AvH and ERC funding recipients by type of institutio
- Table 3-3: The higher education institutions with the highest DFG awards for 2014 to 2016 – overall and by scientific disciplin
- Table 4-1: DFG system of review boards, research areas and scientific discipline
- Table 4-2: Participation in DFG, federal government and EU funding programmes for research by scientific disciplin
- Table 4-3: Number of AvH, DAAD and ERC funding recipients by scientific disciplin
- Table 4-4: Participation in DFG, federal government and EU funding programmes for research by type of institution in the humanities and social science
- Table 4-5: The higher education institutions with the highest DFG awards for 2014 to 2016 in absolute figures and relative to staff size in the humanities and social science
- Table 4-6: Participation in DFG, federal government and EU funding programmes for research by type of institution in the life science
- Table 4-7: The higher education institutions with the highest DFG awards for 2014 to 2016 in absolute figures and relative to staff size in the life science
- Table 4-8: Participation in DFG, federal government and EU funding programmes for research by type of institution in the natural science
- Table 4-9: The higher education institutions with the highest DFG awards for 2014 to 2016 in absolute figures and relative to staff size in the natural science
- Table 4-10 Participation in DFG, federal government and EU funding programmes for research by type of institution in the engineering science
- Table 4-11: The higher education institutions with the highest DFG awards for 2014 to 2016 in absolute figures and relative to staff size in the engineering science
- Table 5-1: DFG-funding opportunities with an international component in 2016, listed by partner countries and type of fundin
- Table 5-2: ERC funding recipients 2014 to 2016 by type of institution and scientific disciplin
- Table 5-3: The most frequently selected host universities by ERC-funded researchers 2014 to 201
- Table Web-1: Income from third-party funding in 2015 per higher education institution by research area (in € million
- Table Web-2: Income from third-party funding in 2015 per higher education institution by funding source (in € million
- Table Web-3: Basic funding, administrative revenues and third-party funding in 2015 per higher education institutio
- Table Web-4: Full-time scientific and artistic personnel and professors at higher education institutions in 2015 by research are
- Table Web-5: Full-time professorial personnel in 2015 per higher education institution by scientific disciplin
- Table Web-6: Full-time scientific and artistic personnel in 2015 per higher education institution by scientific disciplin
- Table Web-7: DFG awards for 2014 to 2016 per higher education institution by research area (in € million
- Table Web-8: DFG awards for 2014 to 2016 in the humanities and social sciences per higher education institution by research field (in € million
- Table Web-9: DFG awards for 2014 to 2016 in the life sciences per higher education institution by research field (in € million
- Table Web-10: DFG awards for 2014 to 2016 in the natural sciences per higher education institution by research field (in € million
- Table Web-11: DFG awards for 2014 to 2016 in the engineering sciences per higher education institution by research field (in € million
- Table Web-12: DFG awards for 2014 to 2016 per higher education institution by funding instrument (in € million
- Table Web-13: Current DFG-funded groups and DFG project leaders in 2016 by funding instrument and gende
- Table Web-14: Current DFG-funded groups and DFG project leaders in 2016 by research area and gende
- Table Web-15: DFG project leaders in 2016 in the humanities and social sciences per higher education institution by research area and gende
- Table Web-16: DFG project leaders in 2016 in the life sciences per higher education institution by research area and gende
- Table Web-17: DFG project leaders in 2016 in the natural sciences per higher education institution by research area and gende
- Table Web-18: DFG project leaders in 2016 in the engineering sciences per higher education institution by research area and gende
- Table Web-19: DFG awards for 2014 to 2016 per non-university research institution by research area (in € million
- Table Web-20: DFG awards for 2014 to 2016 per university medical institution by funding instrument (in € million
- Table Web-21: DFG awards to university medical institutions for 2014 to 2016 in absolute figures and relative to staff siz
- Table Web-22: Reporting logic derived from the federal government's planning system for R&D project fundin
- Table Web-23: R&D project funding from the federal government 2014 to 2016 per higher education institution by funding area (in € million
- Table Web-24: R&D project funding from the federal government 2014 to 2016 per non-university research institution by funding area (in € million
- Table Web-25: R&D funding under the AiF's IGF programme from 2014 to 2016 by higher education institutio
- Table Web-26: Funding in Horizon 2020 – EU Framework Programme for Research and Innovation 2014 to 2016 per higher education institution by programme section (in € million
- Table Web-27: ERC-funded researchers 2014 to 2016 per higher education institution by scientific disciplin
- Table Web-28: Funding in Horizon 2020 – EU Framework Programme for Research and Innovation 2014 to 2106 per non-university research institution by programme section (in € million
- Table Web-29: Research visits by AvH guest researchers 2012 to 2016 per higher education institution by research are
- Table Web-30: Research visits by DAAD-funded researchers 2012 to 2016 per higher education institution by research are
- Table Web-31: Research visits by DAAD-funded graduates 2012 to 2016 per higher education institution by research are
- Table Web-32: Alignment of the classification system of teaching and research fields and subject areas used by the Federal Statistical Office and the DFG subject classification system of research areas and scientific discipline
- Table Web-33: Income from third-party funding in 2015 relative to numbers of full-time scientific personnel employed at universities by research are
- Table Web-34: DFG awards for 2014 to 2016 relative to numbers of full-time scientific personnel employed at universities by research are
- Table Web-35: R&D funding from the federal government and the EU for medical research per higher education institution in absolute figure
- Table Web-36: International research funding by the DFG 2016 by partner country, partner organisation and type of research fundin
- Table Web-37: Load matrix for the principal component analysis of the 40 universities with the greatest volume of DFG awards for 2014 to 2016 by research are
- Table Web-38: Incomes of higher education institutions in 201
- Table Web-39: Basic funding and third-party funding of selected non-university research institutions in 201
- Table Web-40: Personnel employed at higher education institutions and non-university research institutions in 201
- Table Web-41: Funding in Horizon 2020 – EU Framework Programme for Research and Innovation 2014 to 2016 by programme sectio
- Table Web-41: Funding in Horizon 2020 – EU Framework Programme for Research and Innovation 2014 to 2016 by programme sectio
- Table Web-42: R&D project funding from the federal government 2014 to 2016 by funding are
- Table Web-43: The most frequent countries of origin of AvH-funded researchers 2012 to 201
- Table Web-44: The most frequent countries of origin of DAAD-funded researchers 2012 to 201
- Table Web-45: The most frequently selected host universities by AvH, DAAD and ERC funding recipients in the humanities and social science
- Table Web-46: The higher education institutions with the highest DFG awards for 2014 to 2016 in the humanitie
- Table Web-48: The most frequently selected host universities by AvH, DAAD and ERC funding recipients in the life science
- Table Web-49: The higher education institutions with the highest DFG awards for 2014 to 2016 in biolog
- Table Web-50: The higher education institutions with the highest DFG awards for 2014 to 2016 in medicin
- Table Web-51: The higher education institutions with the highest DFG awards for 2014 to 2016 in agriculture, forestry and veterinary medicin
- Table Web-52: The most frequently selected host universities by AvH, DAAD and ERC funding recipients in the natural science
- Table Web-53: The higher education institutions with the highest DFG awards for 2014 to 2016 in chemistr
- Table Web-54: The higher education institutions with the highest DFG awards for 2014 to 2016 in physic
- Table Web-55: The higher education institutions with the highest DFG awards for 2014 to 2016 in mathematic
- Table Web-56: The higher education institutions with the highest DFG awards for 2014 to 2016 in geoscience
- Table Web-57: The most frequently selected host universities by AvH, DAAD and ERC funding recipients in the engineering science
- Table Web-58: The higher education institutions with the highest funding under the AiF’s IGF programme 2014 to 201
- Table Web-59: The higher education institutions with the highest DFG awards for 2014 to 2016 in mechanical and industrial engineerin
- Table Web-60: The higher education institutions with the highest DFG awards for 2014 to 2016 in thermal engineering/process engineerin
- Table Web-61: The higher education institutions with the highest DFG awards for 2014 to 2016 in materials science and engineerin
- Table Web-62: The higher education institutions with the highest DFG awards for 2014 to 2016 in computer science, systems and electrical engineerin
- Table Web-63: Absolute R&D funding from the federal government and EU from 2014 to 2016 by higher education institution in information and communication technologie
- Table Web-64: The higher education institutions with the highest DFG awards for 2014 to 2016 in construction engineering and architectur
- Table Web-65: DFG system of subject areas, review boards and scientific discipline
Figures
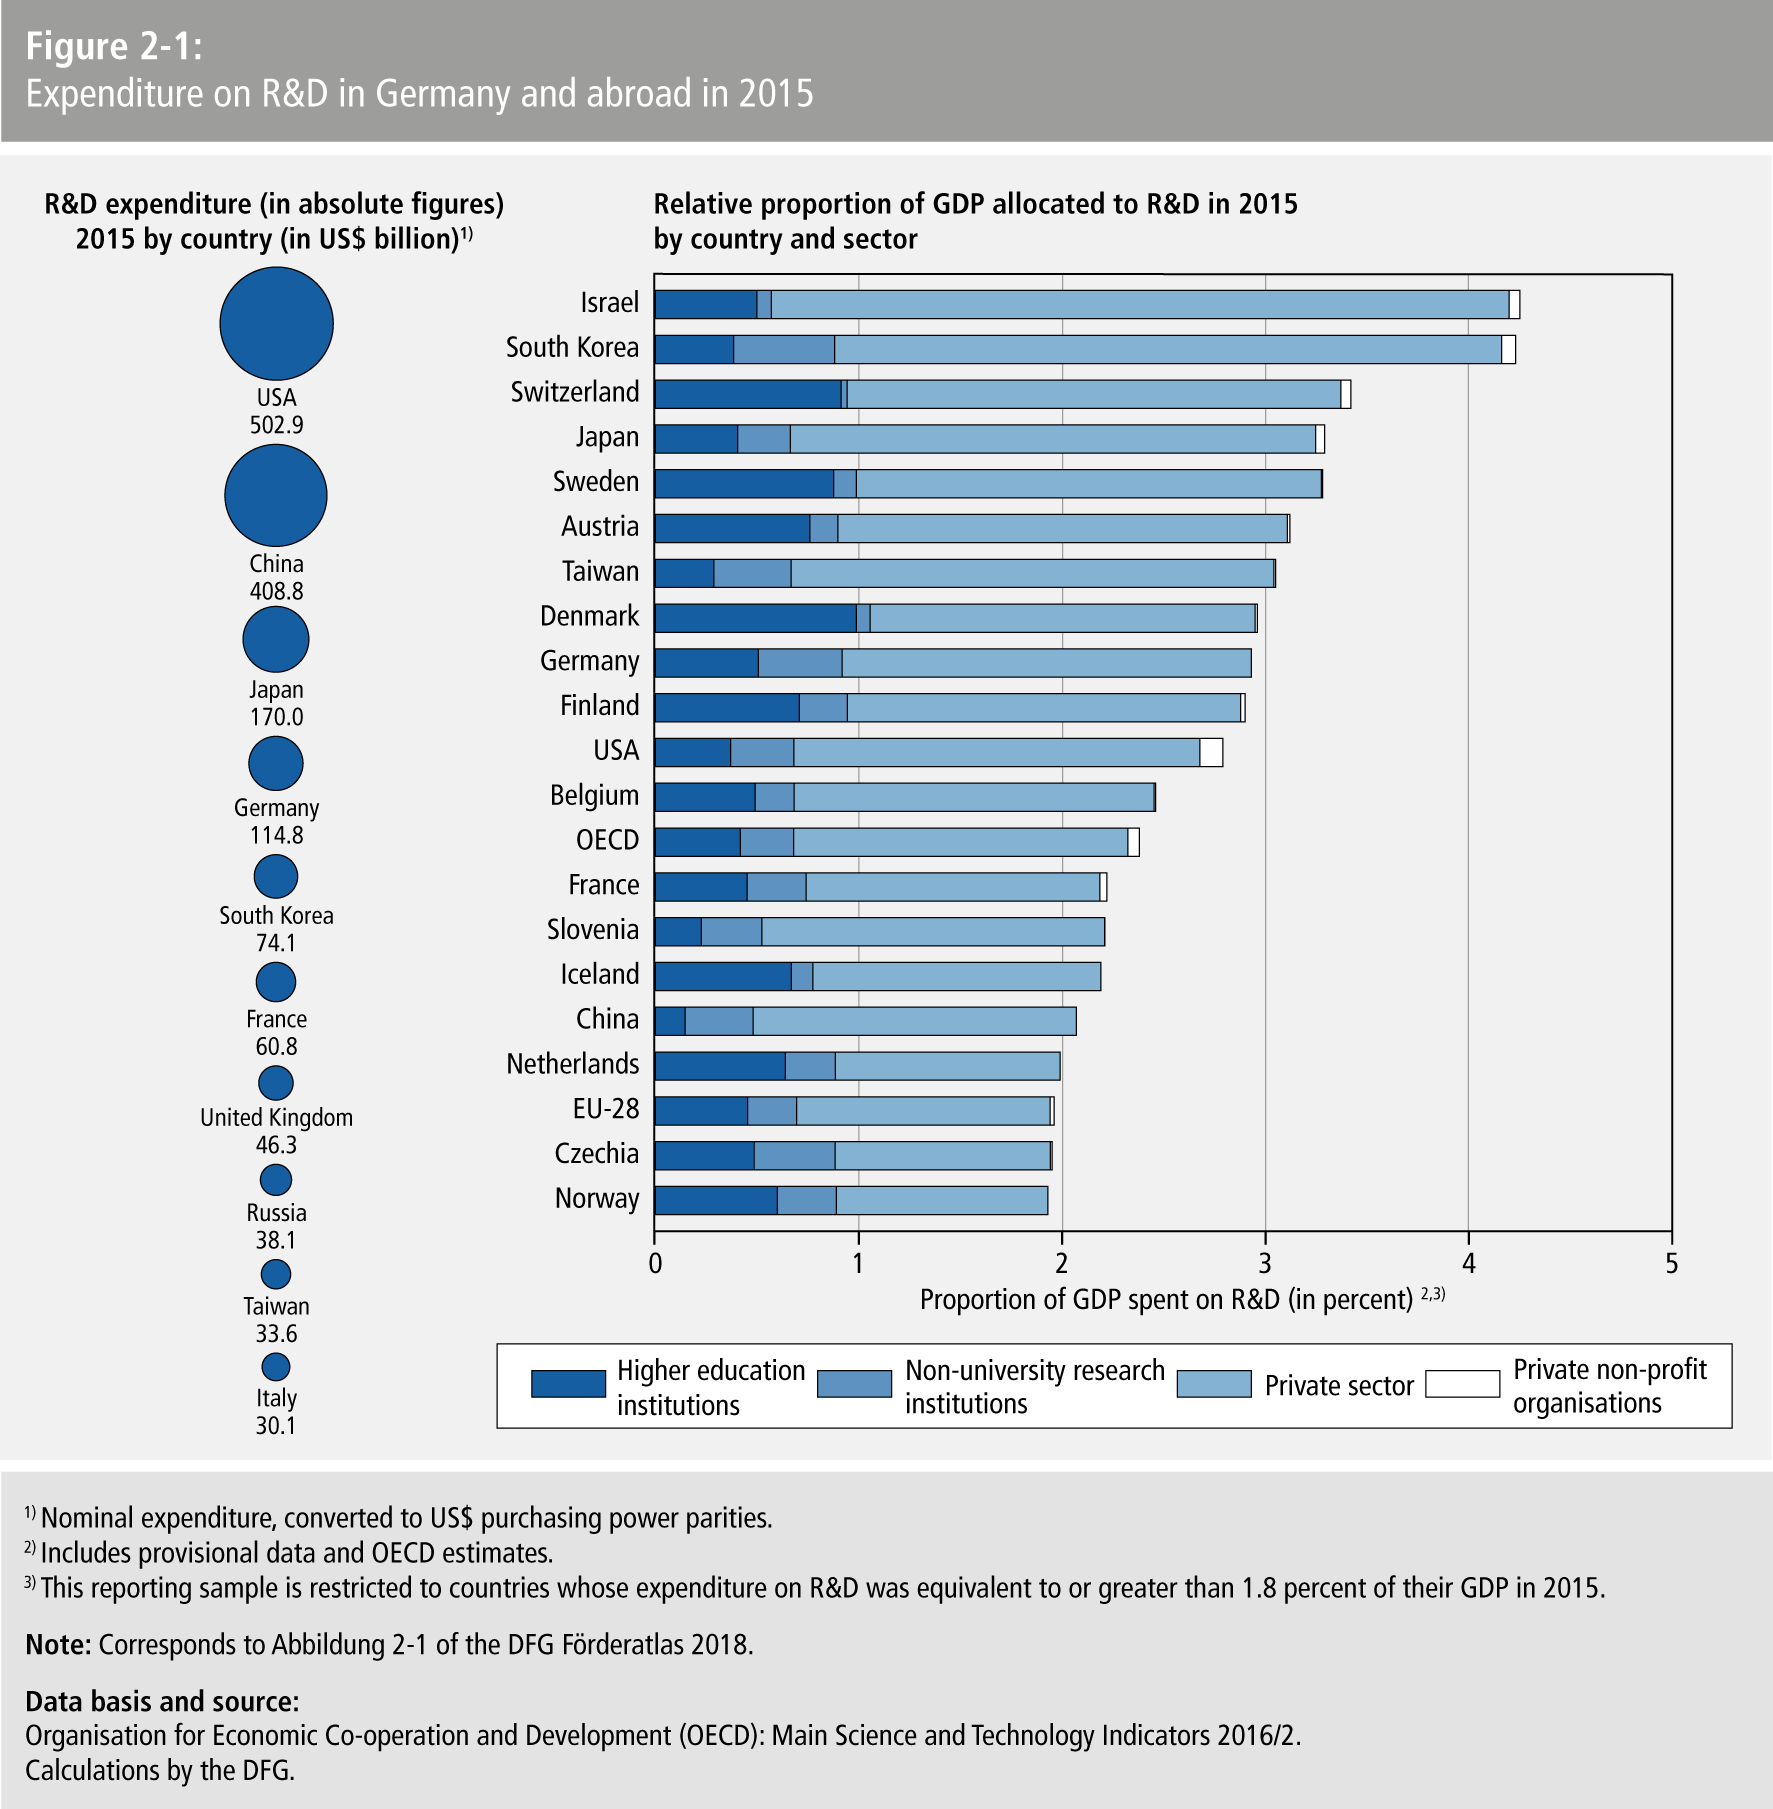
- Figure 2-1: Expenditure on R&D in Germany and abroad in 201
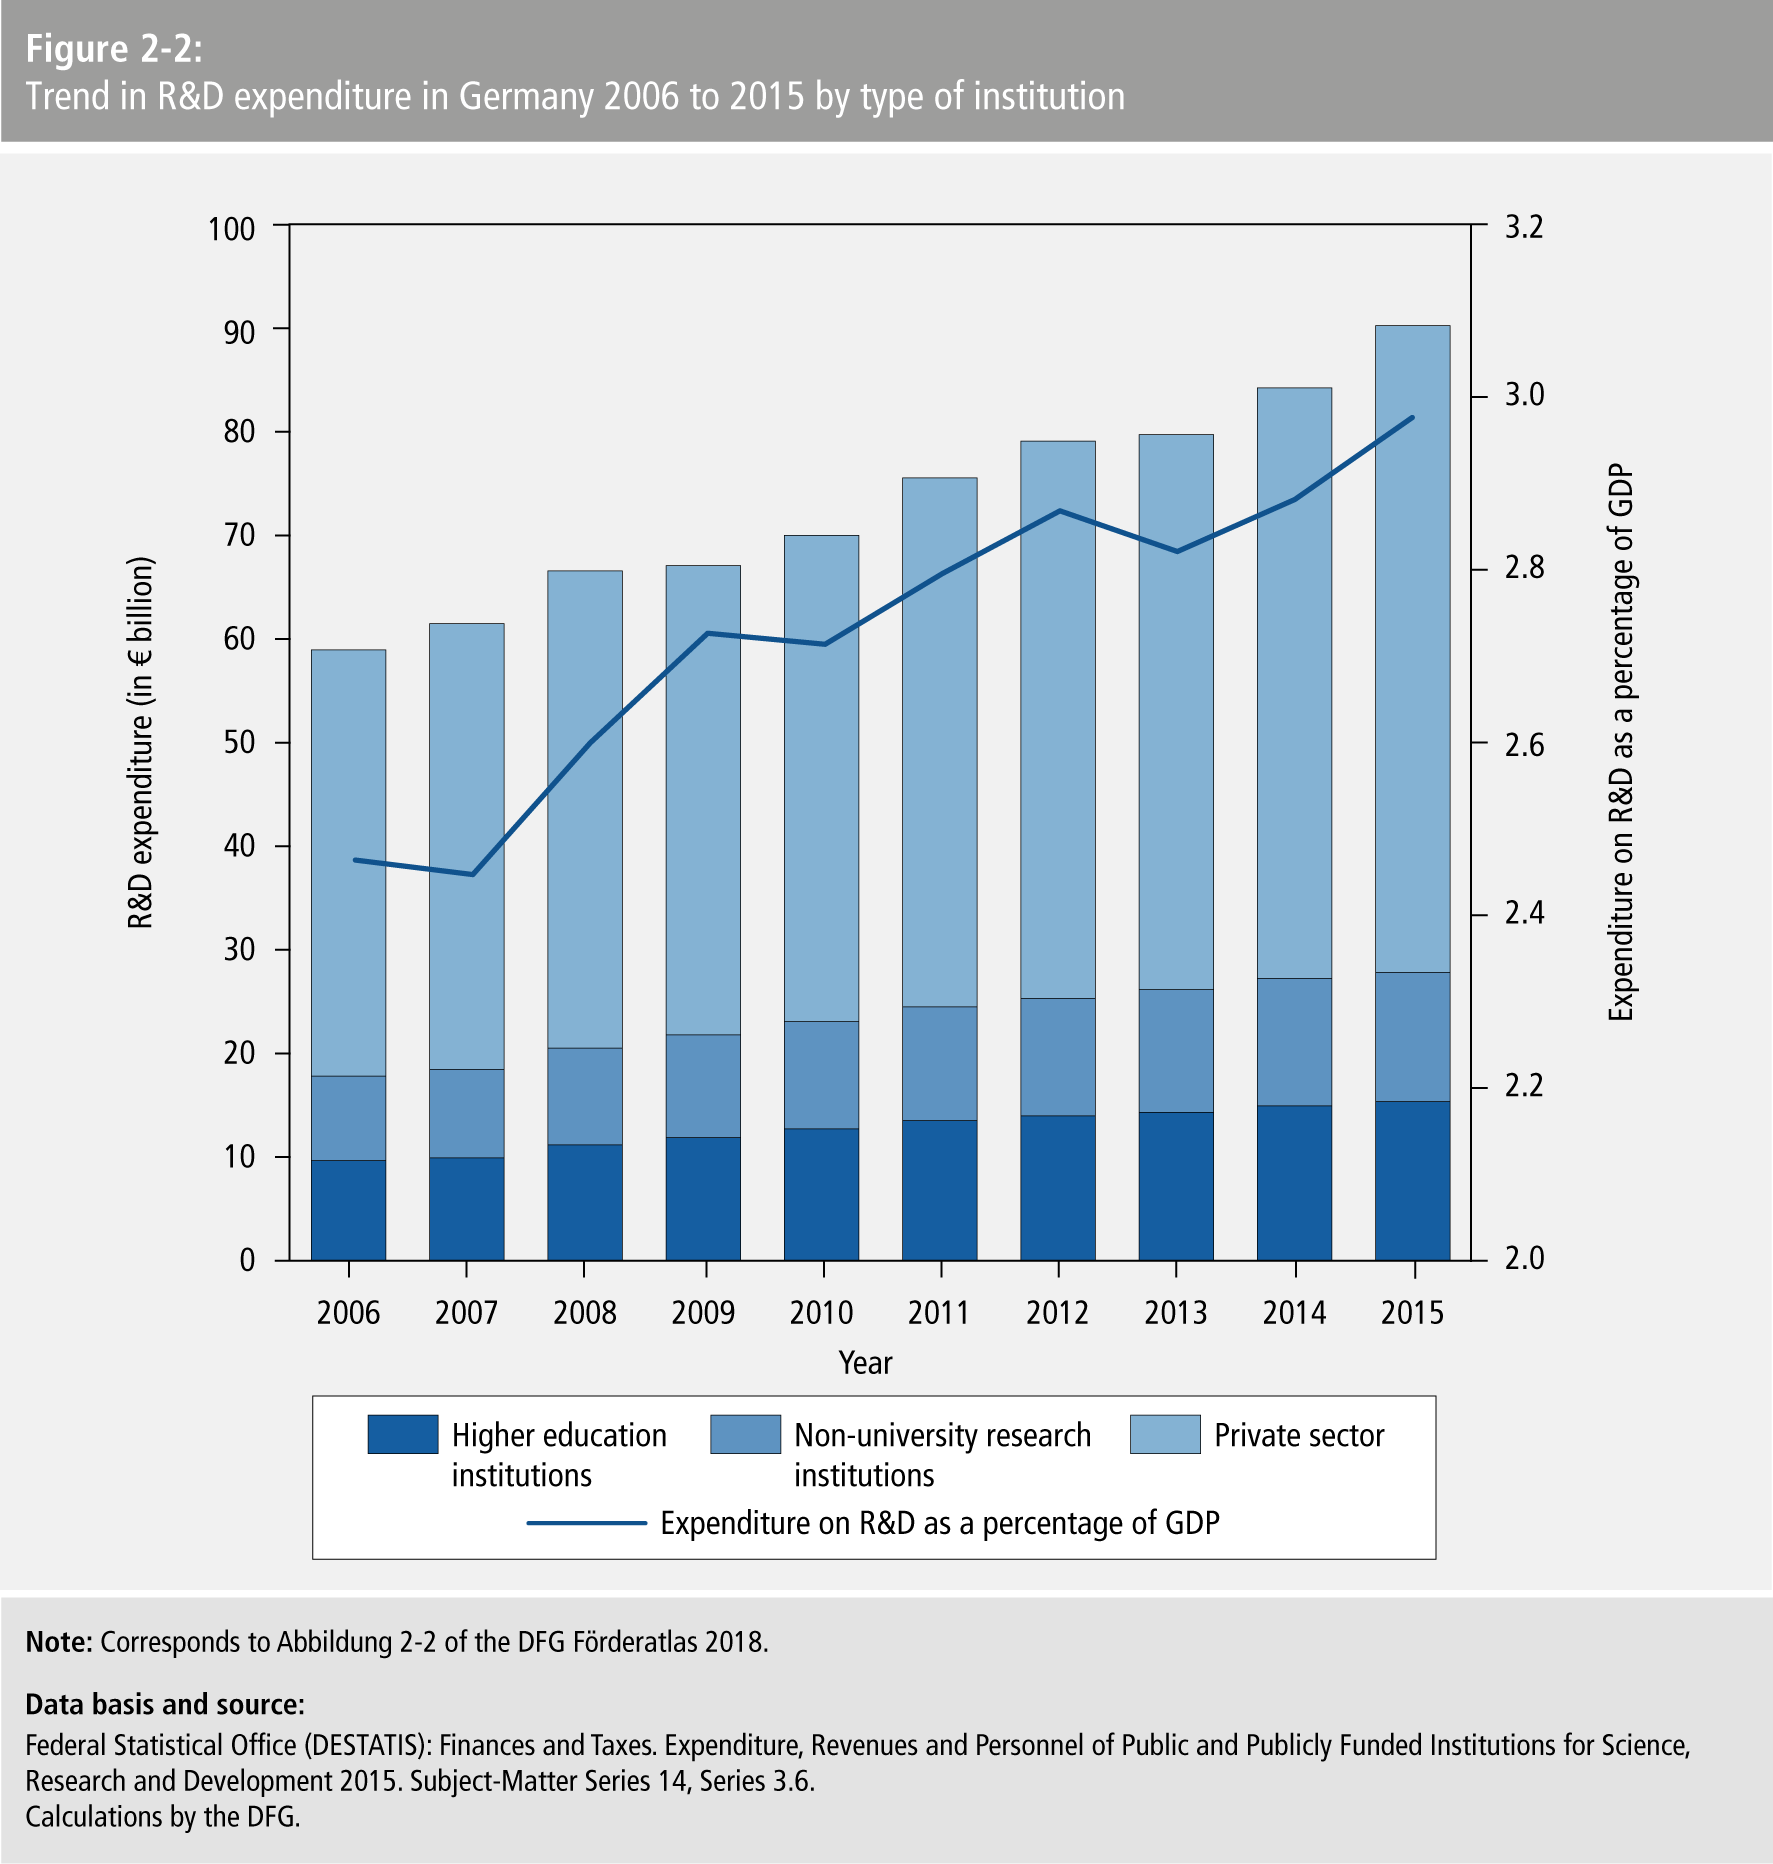
- Figure 2-2: Trend in R&D expenditure in Germany 2006 to 2015 by type of institutio
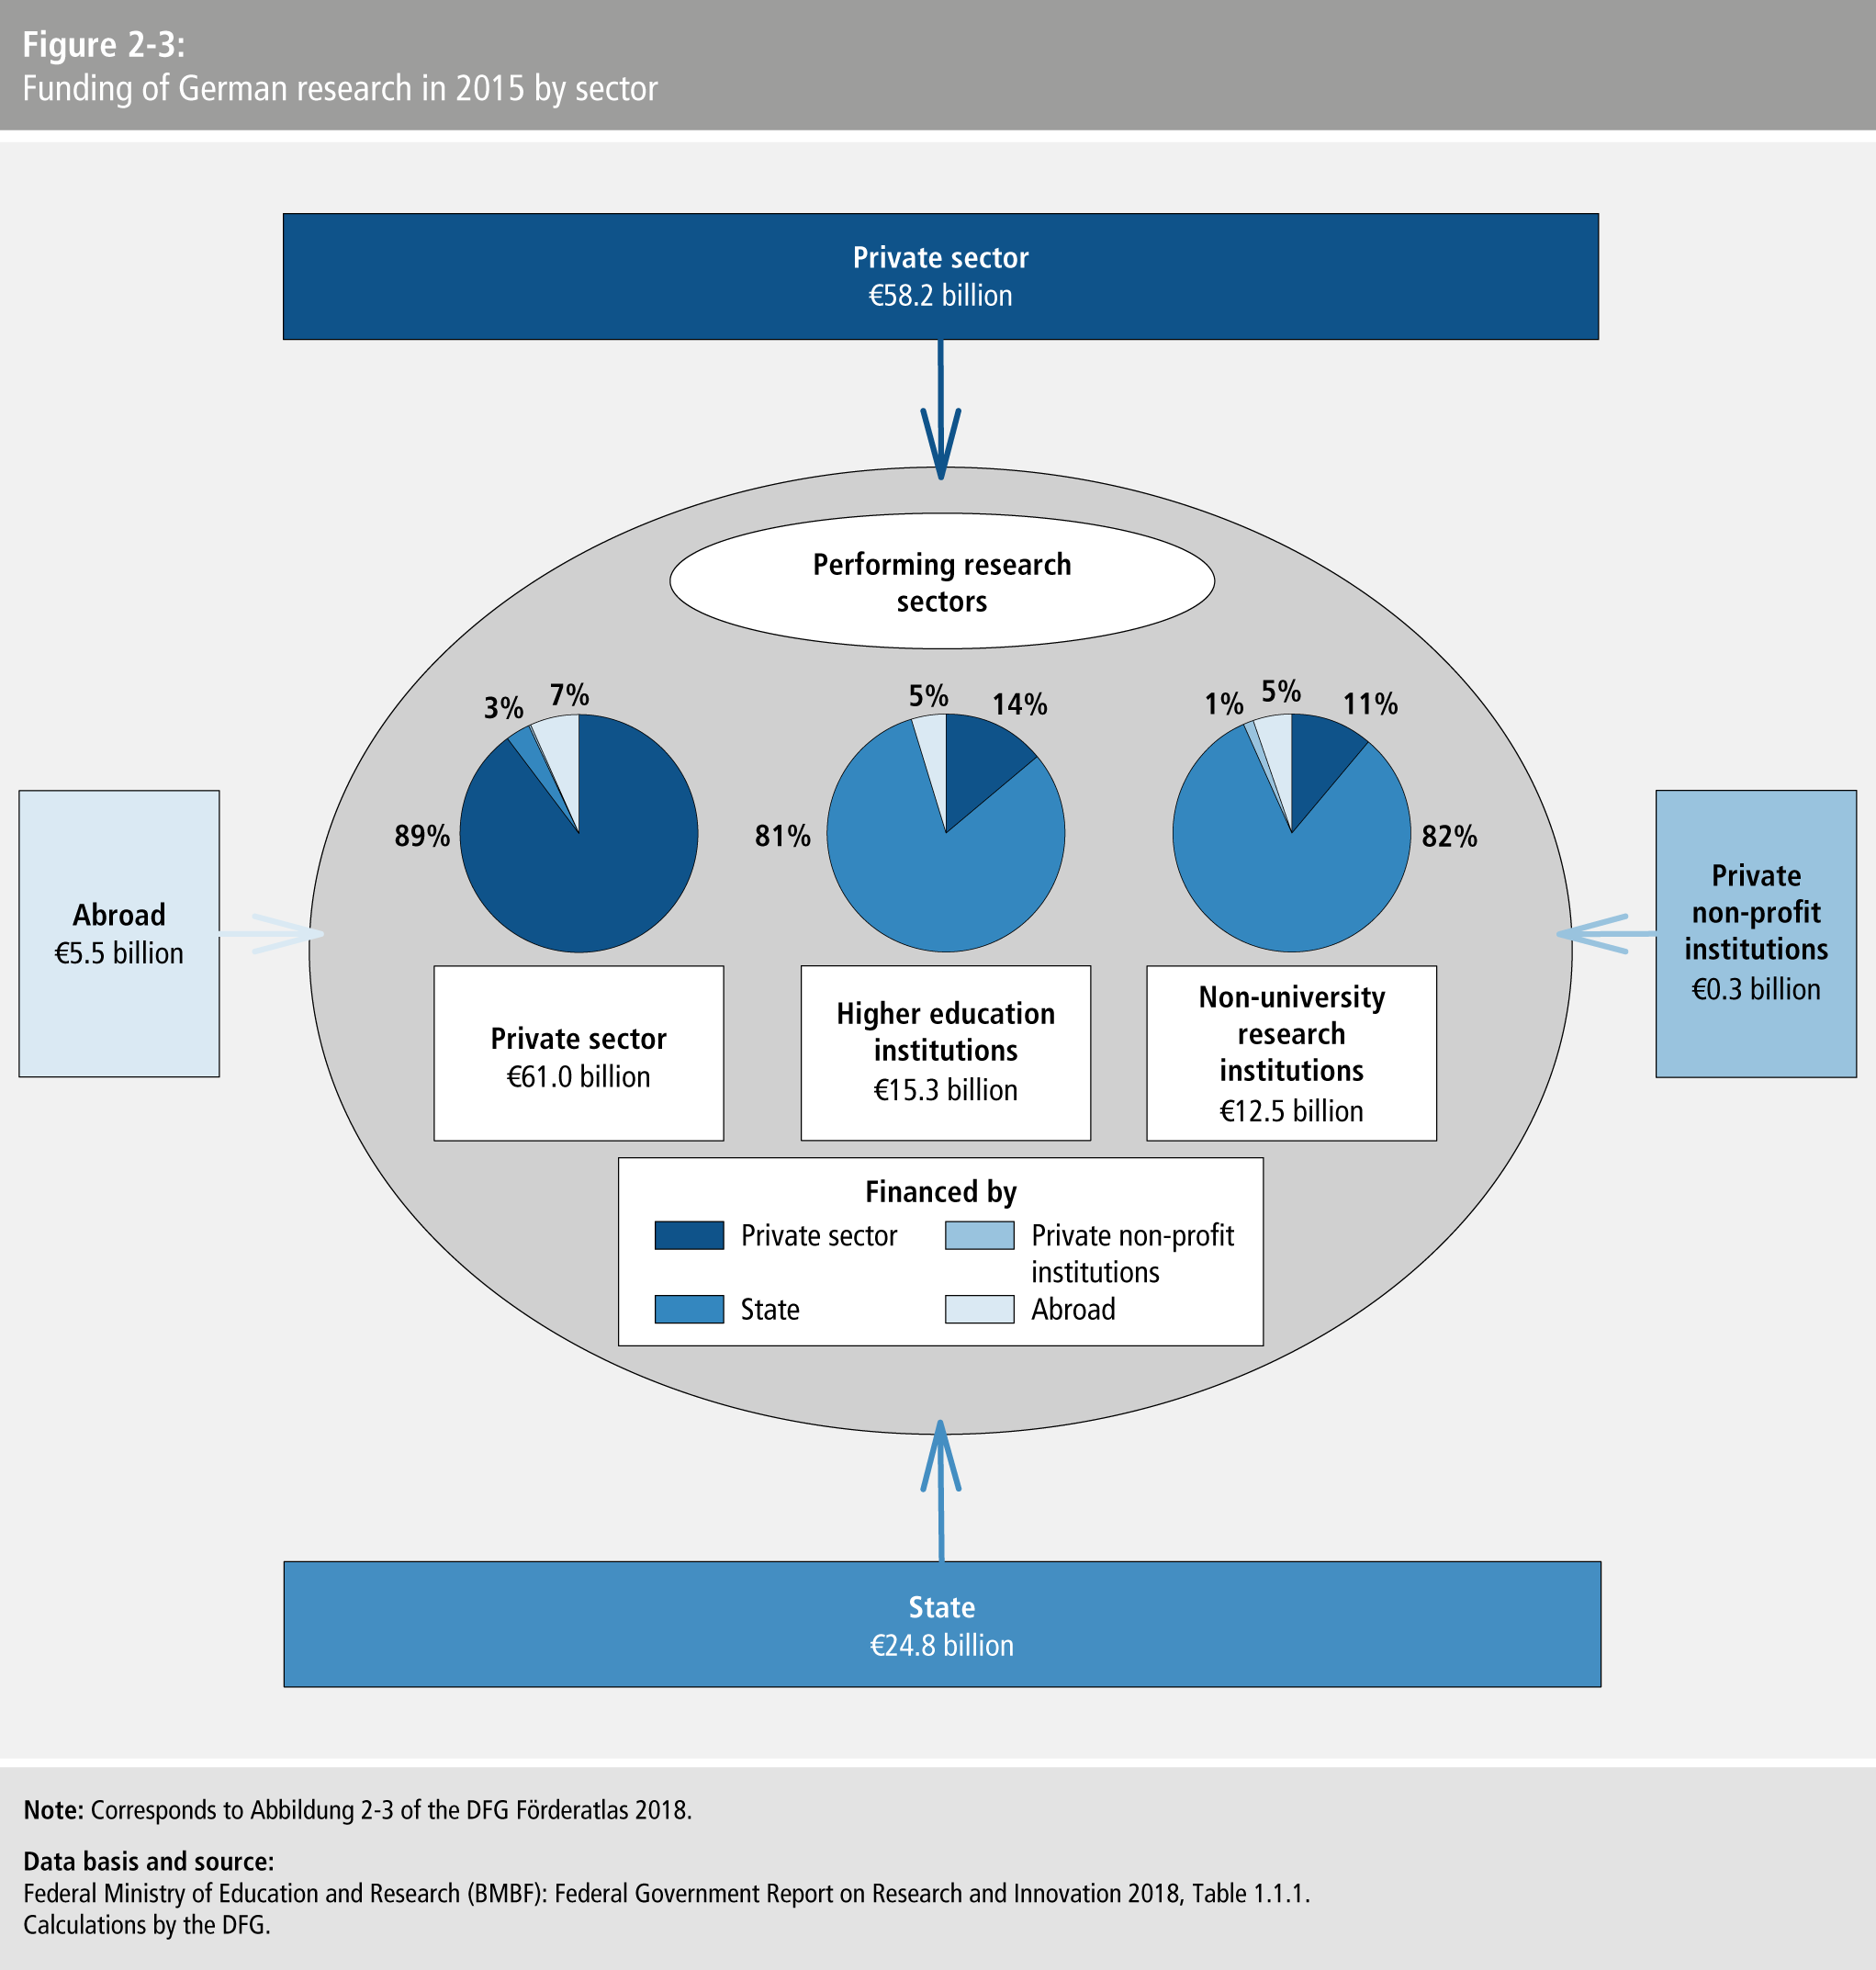
- Figure 2-3: Funding of German research in 2015 by secto
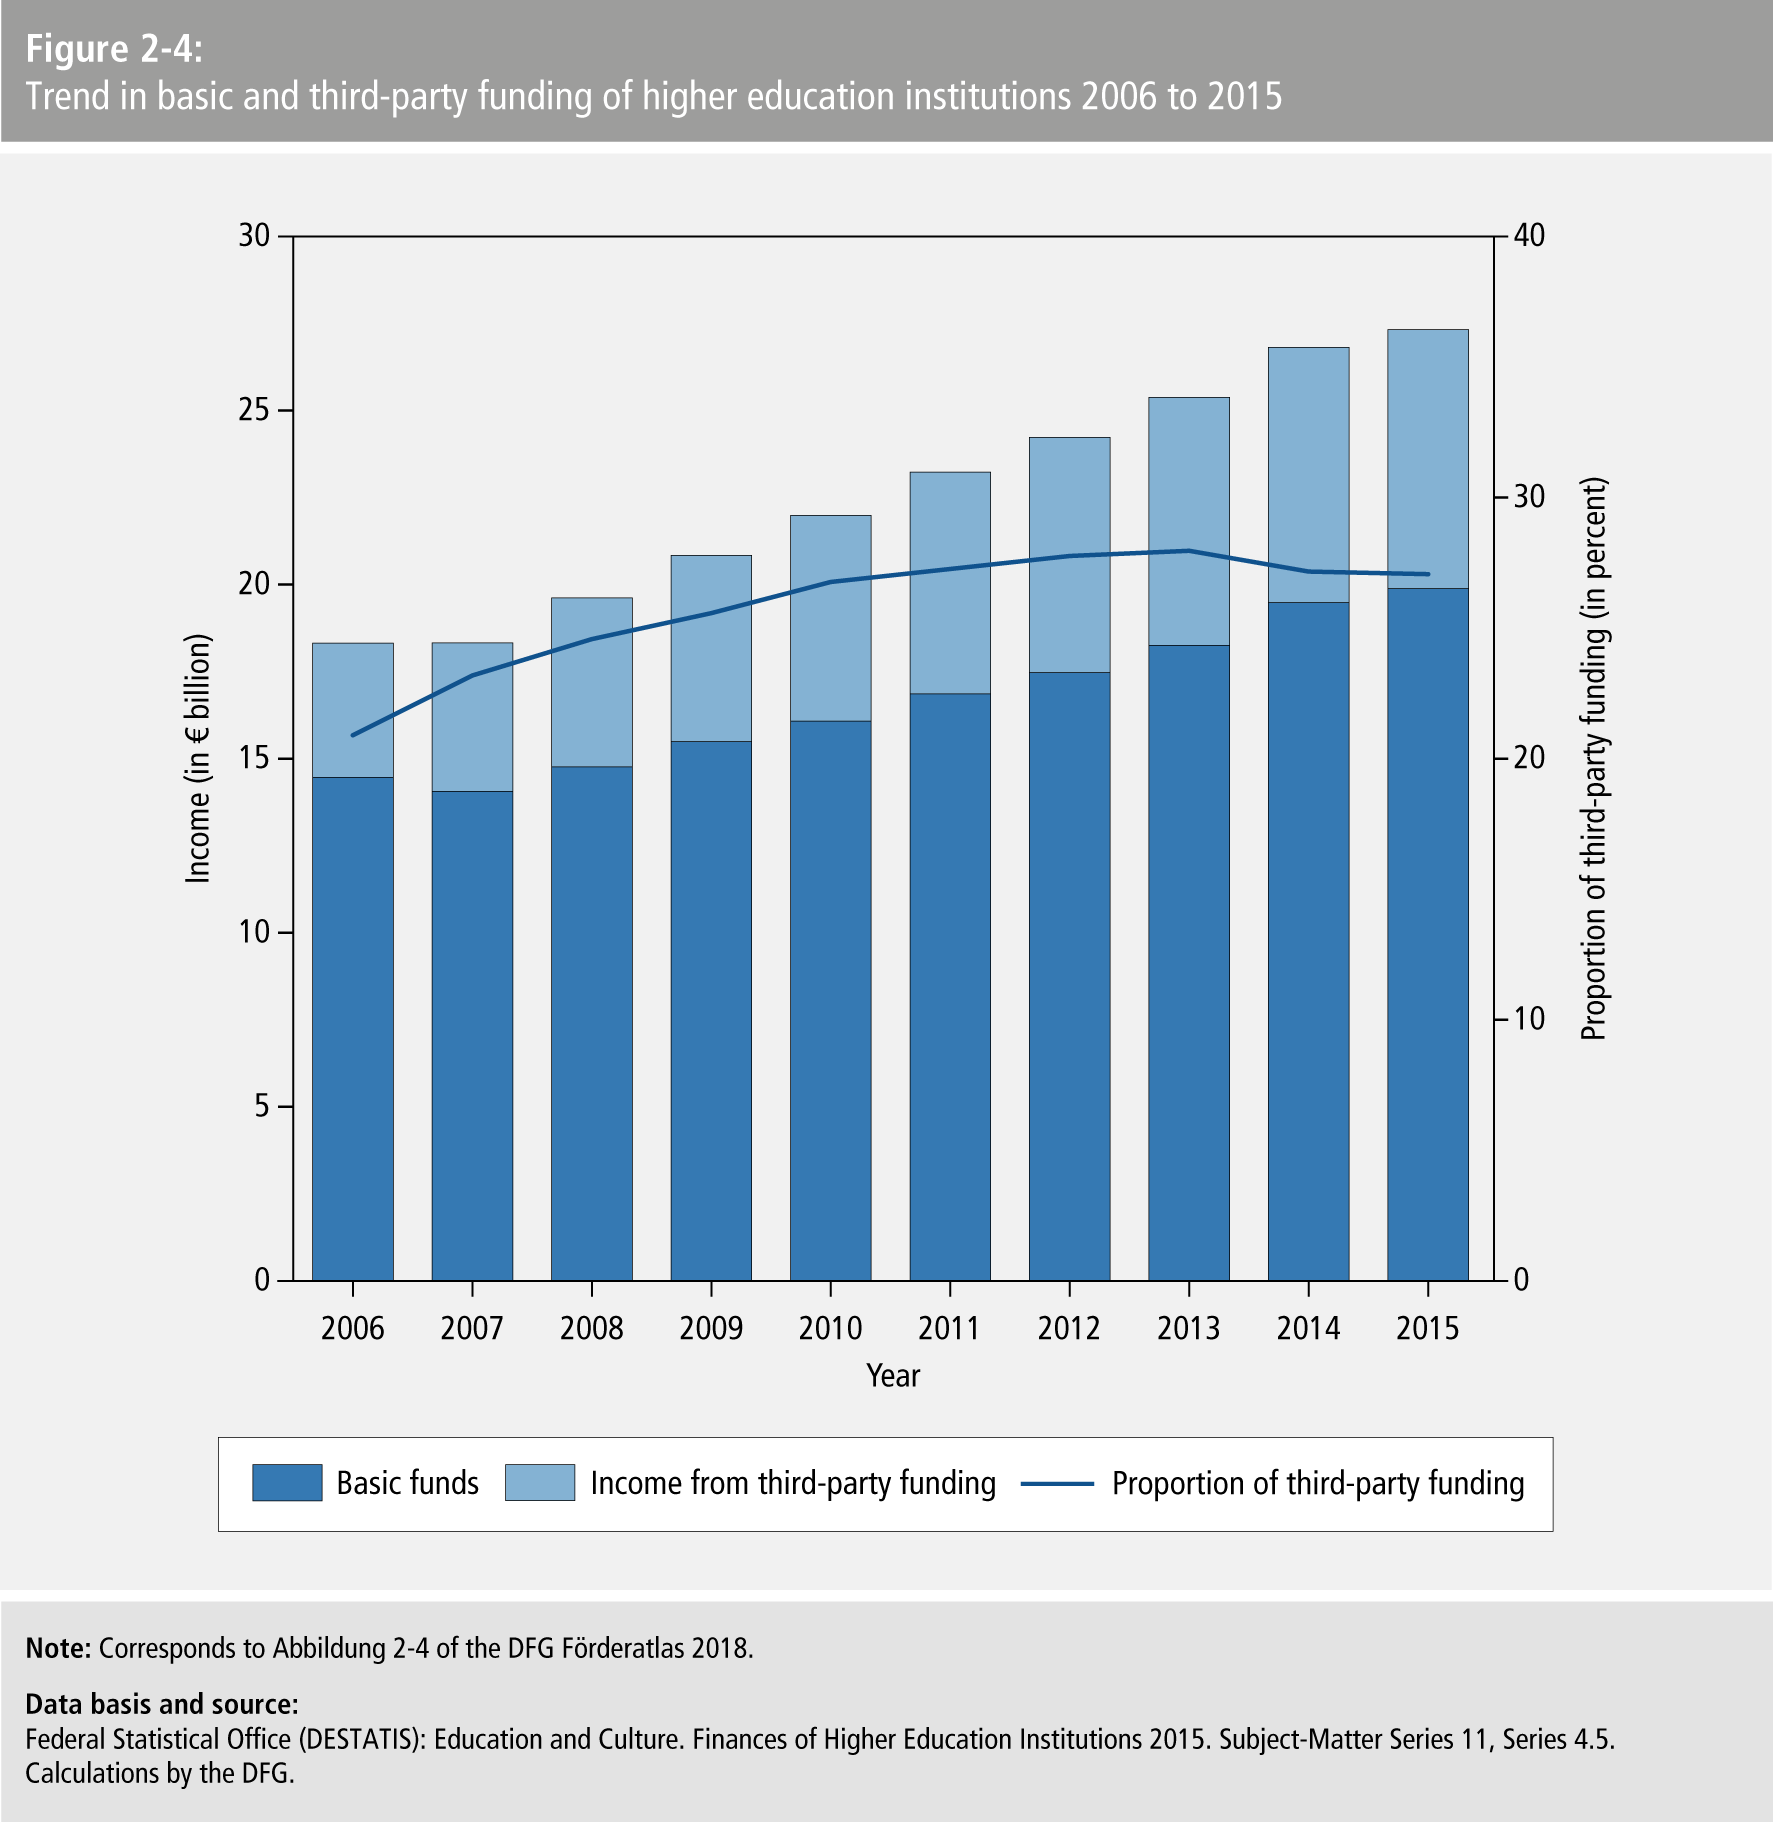
- Figure 2-4: Trend in basic and third-party funding of higher education institutions 2006 to 201
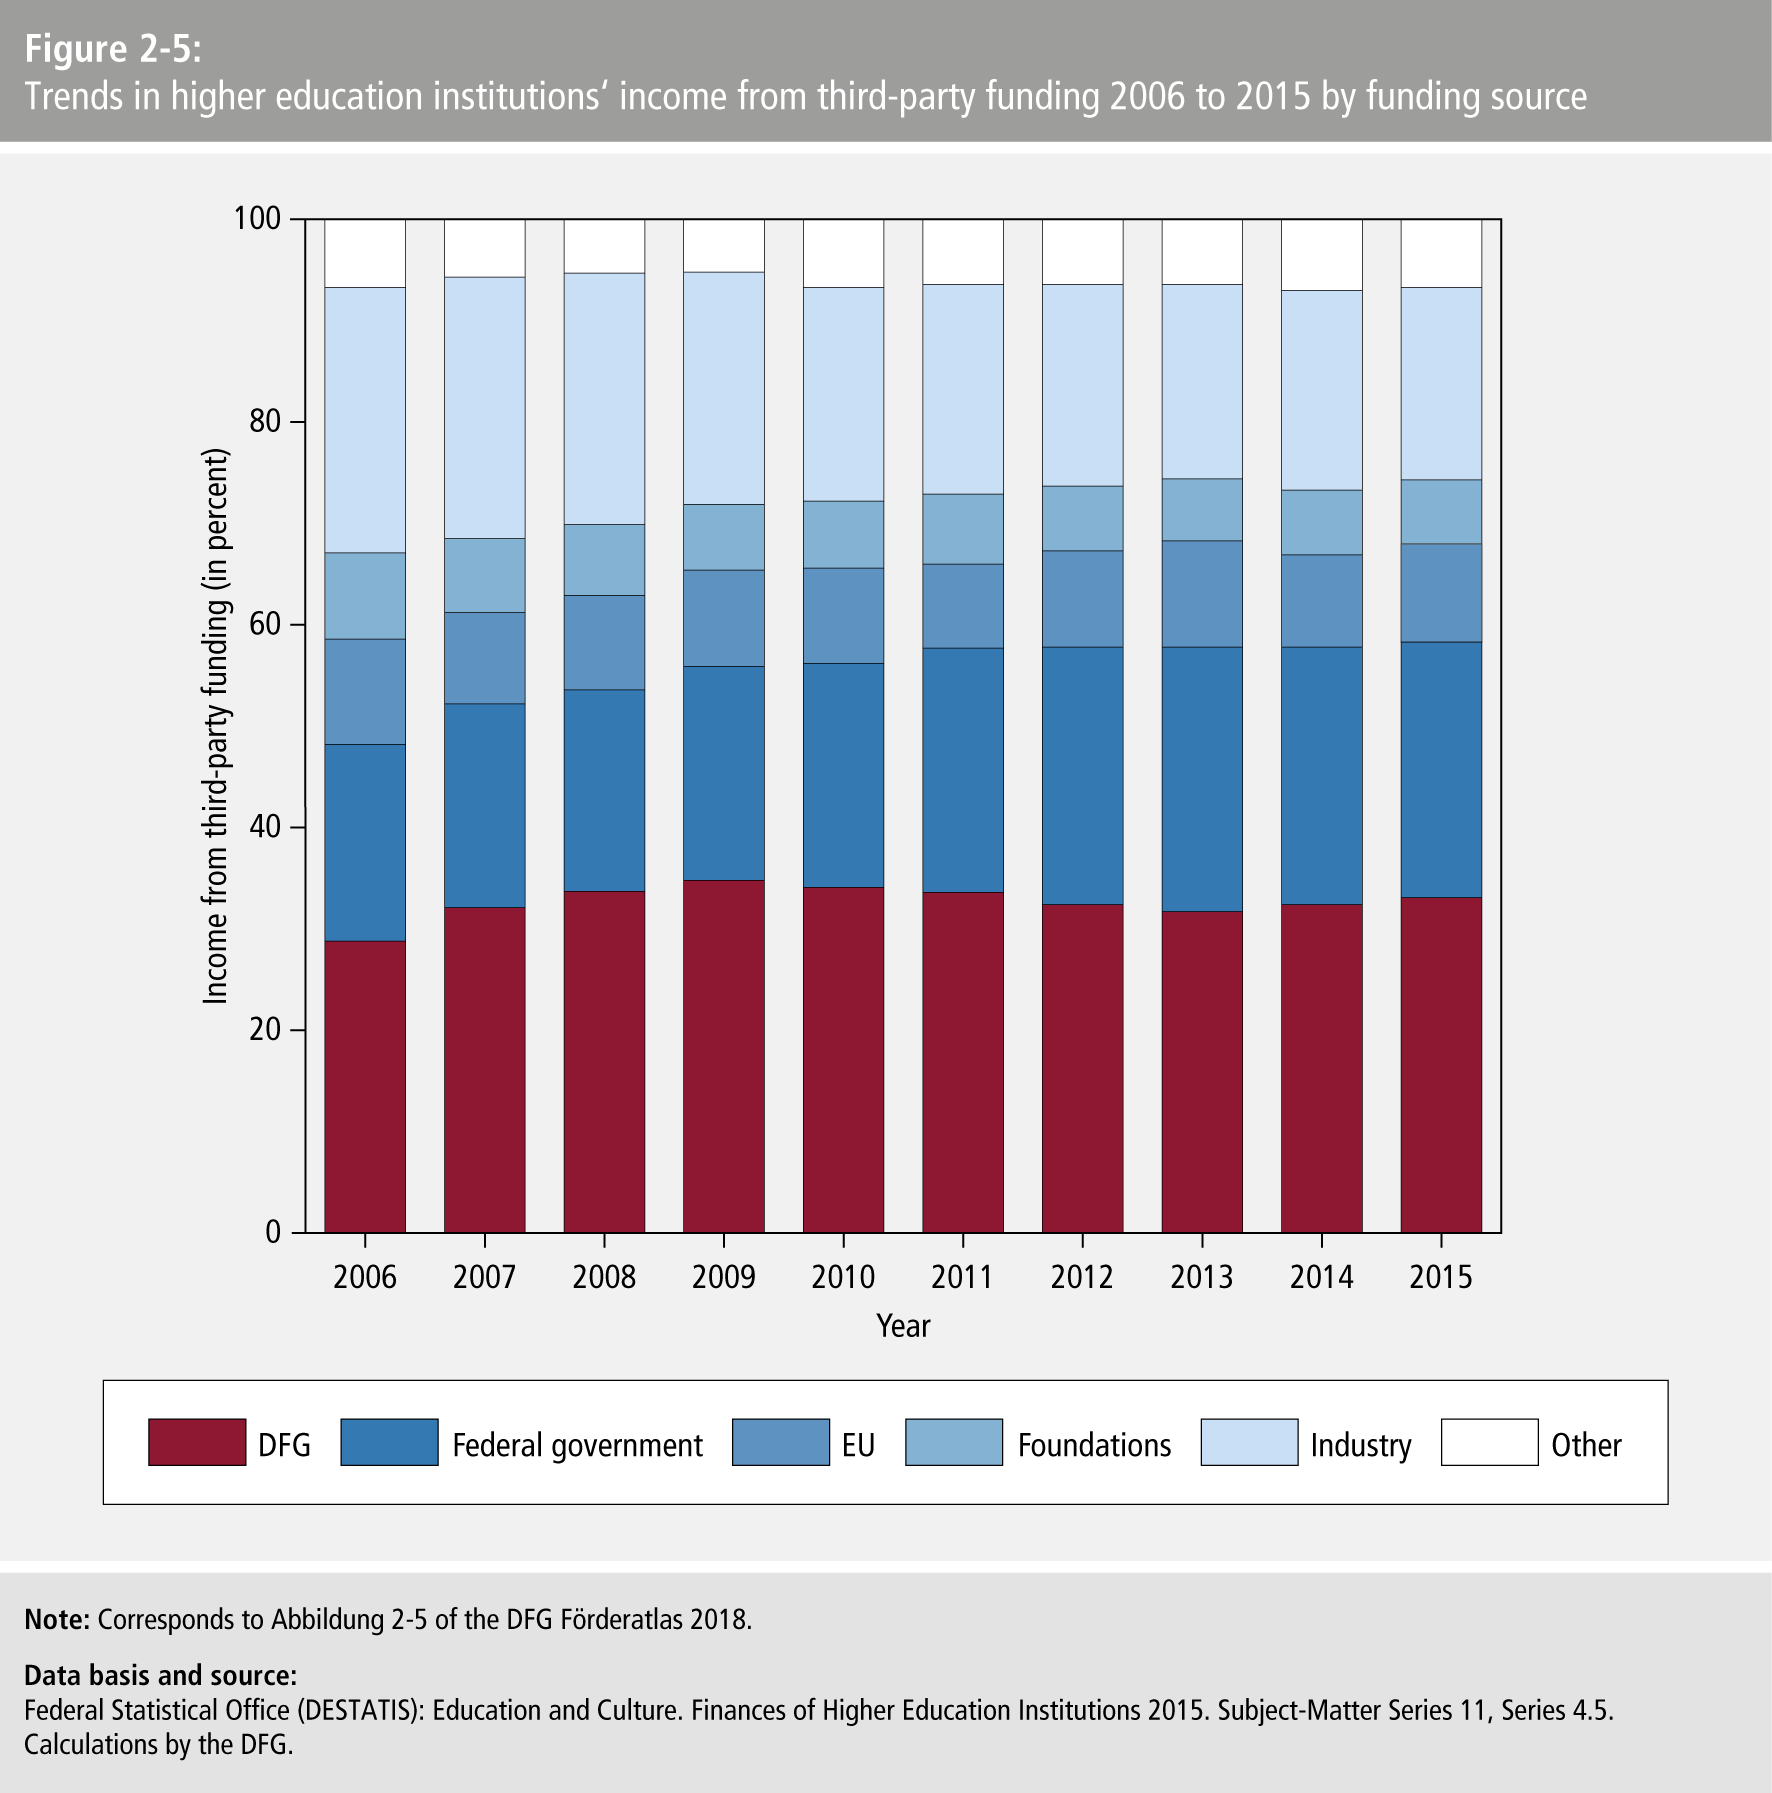
- Figure 2-5: Trends in higher education institutions‘ income from third-party funding 2006 to 2015 by funding sourc
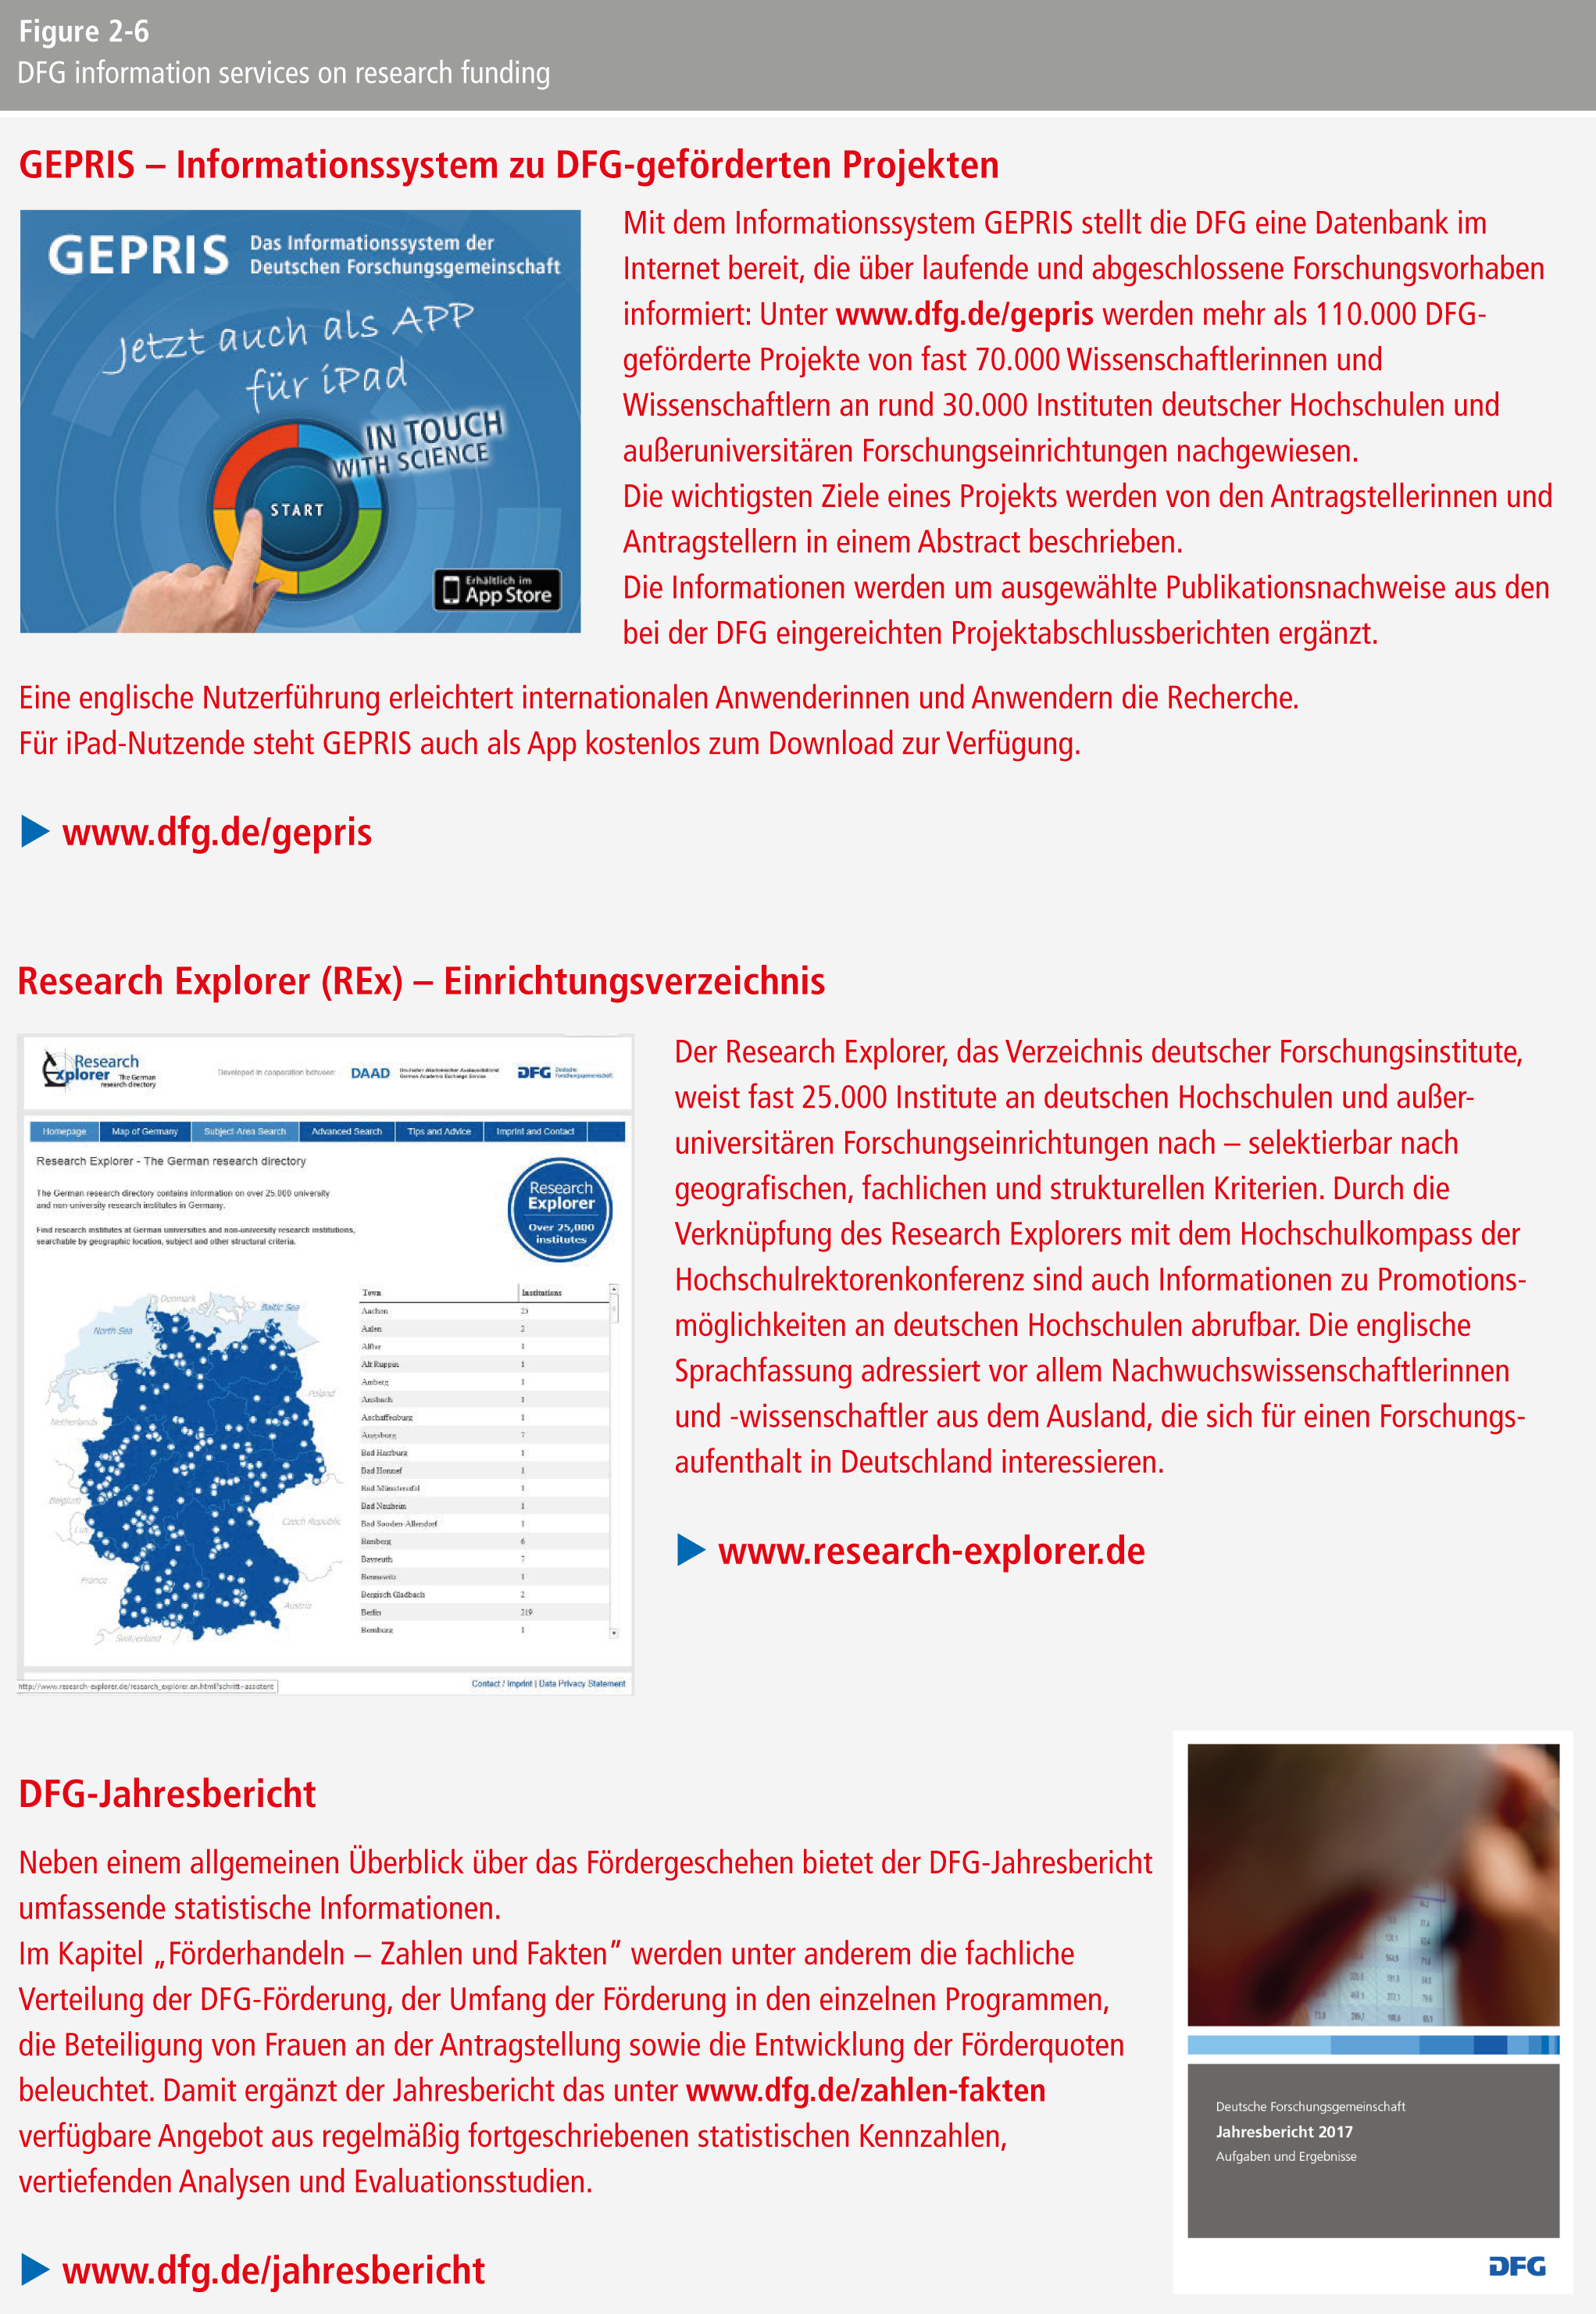
- Figure 2-6: DFG information services on research fundin
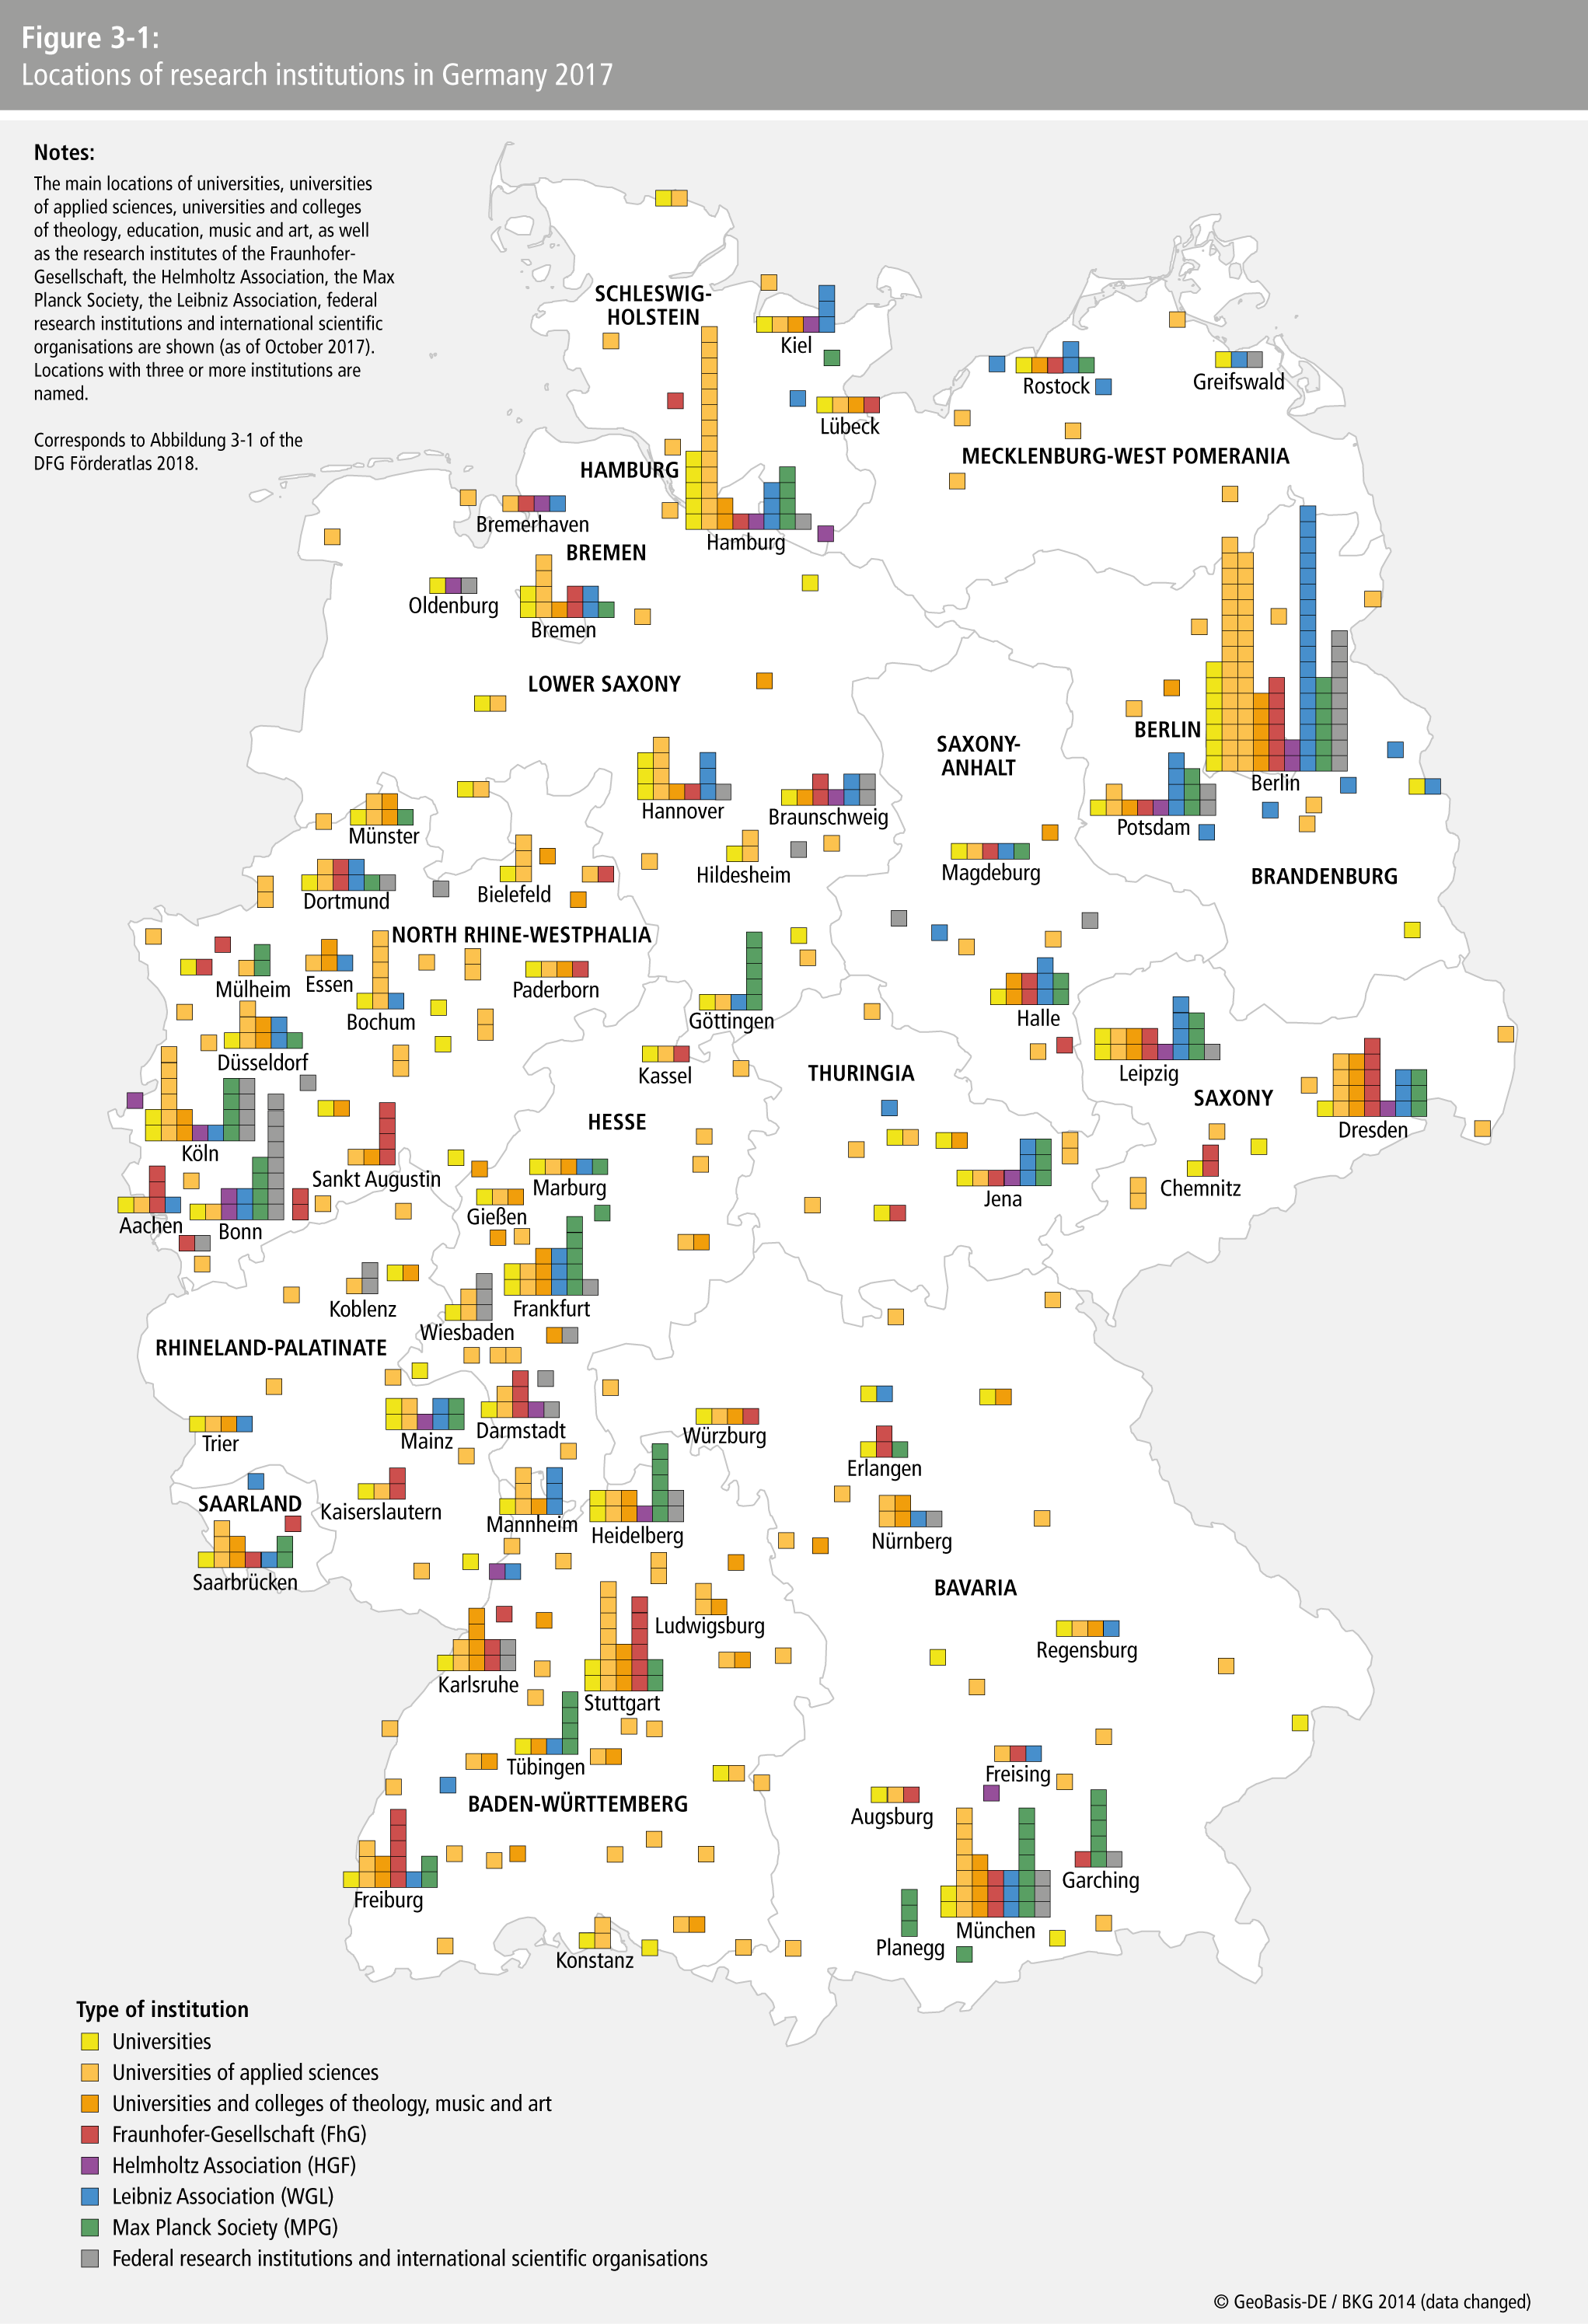
- Figure 3-1: Locations of research institutions in Germany 201
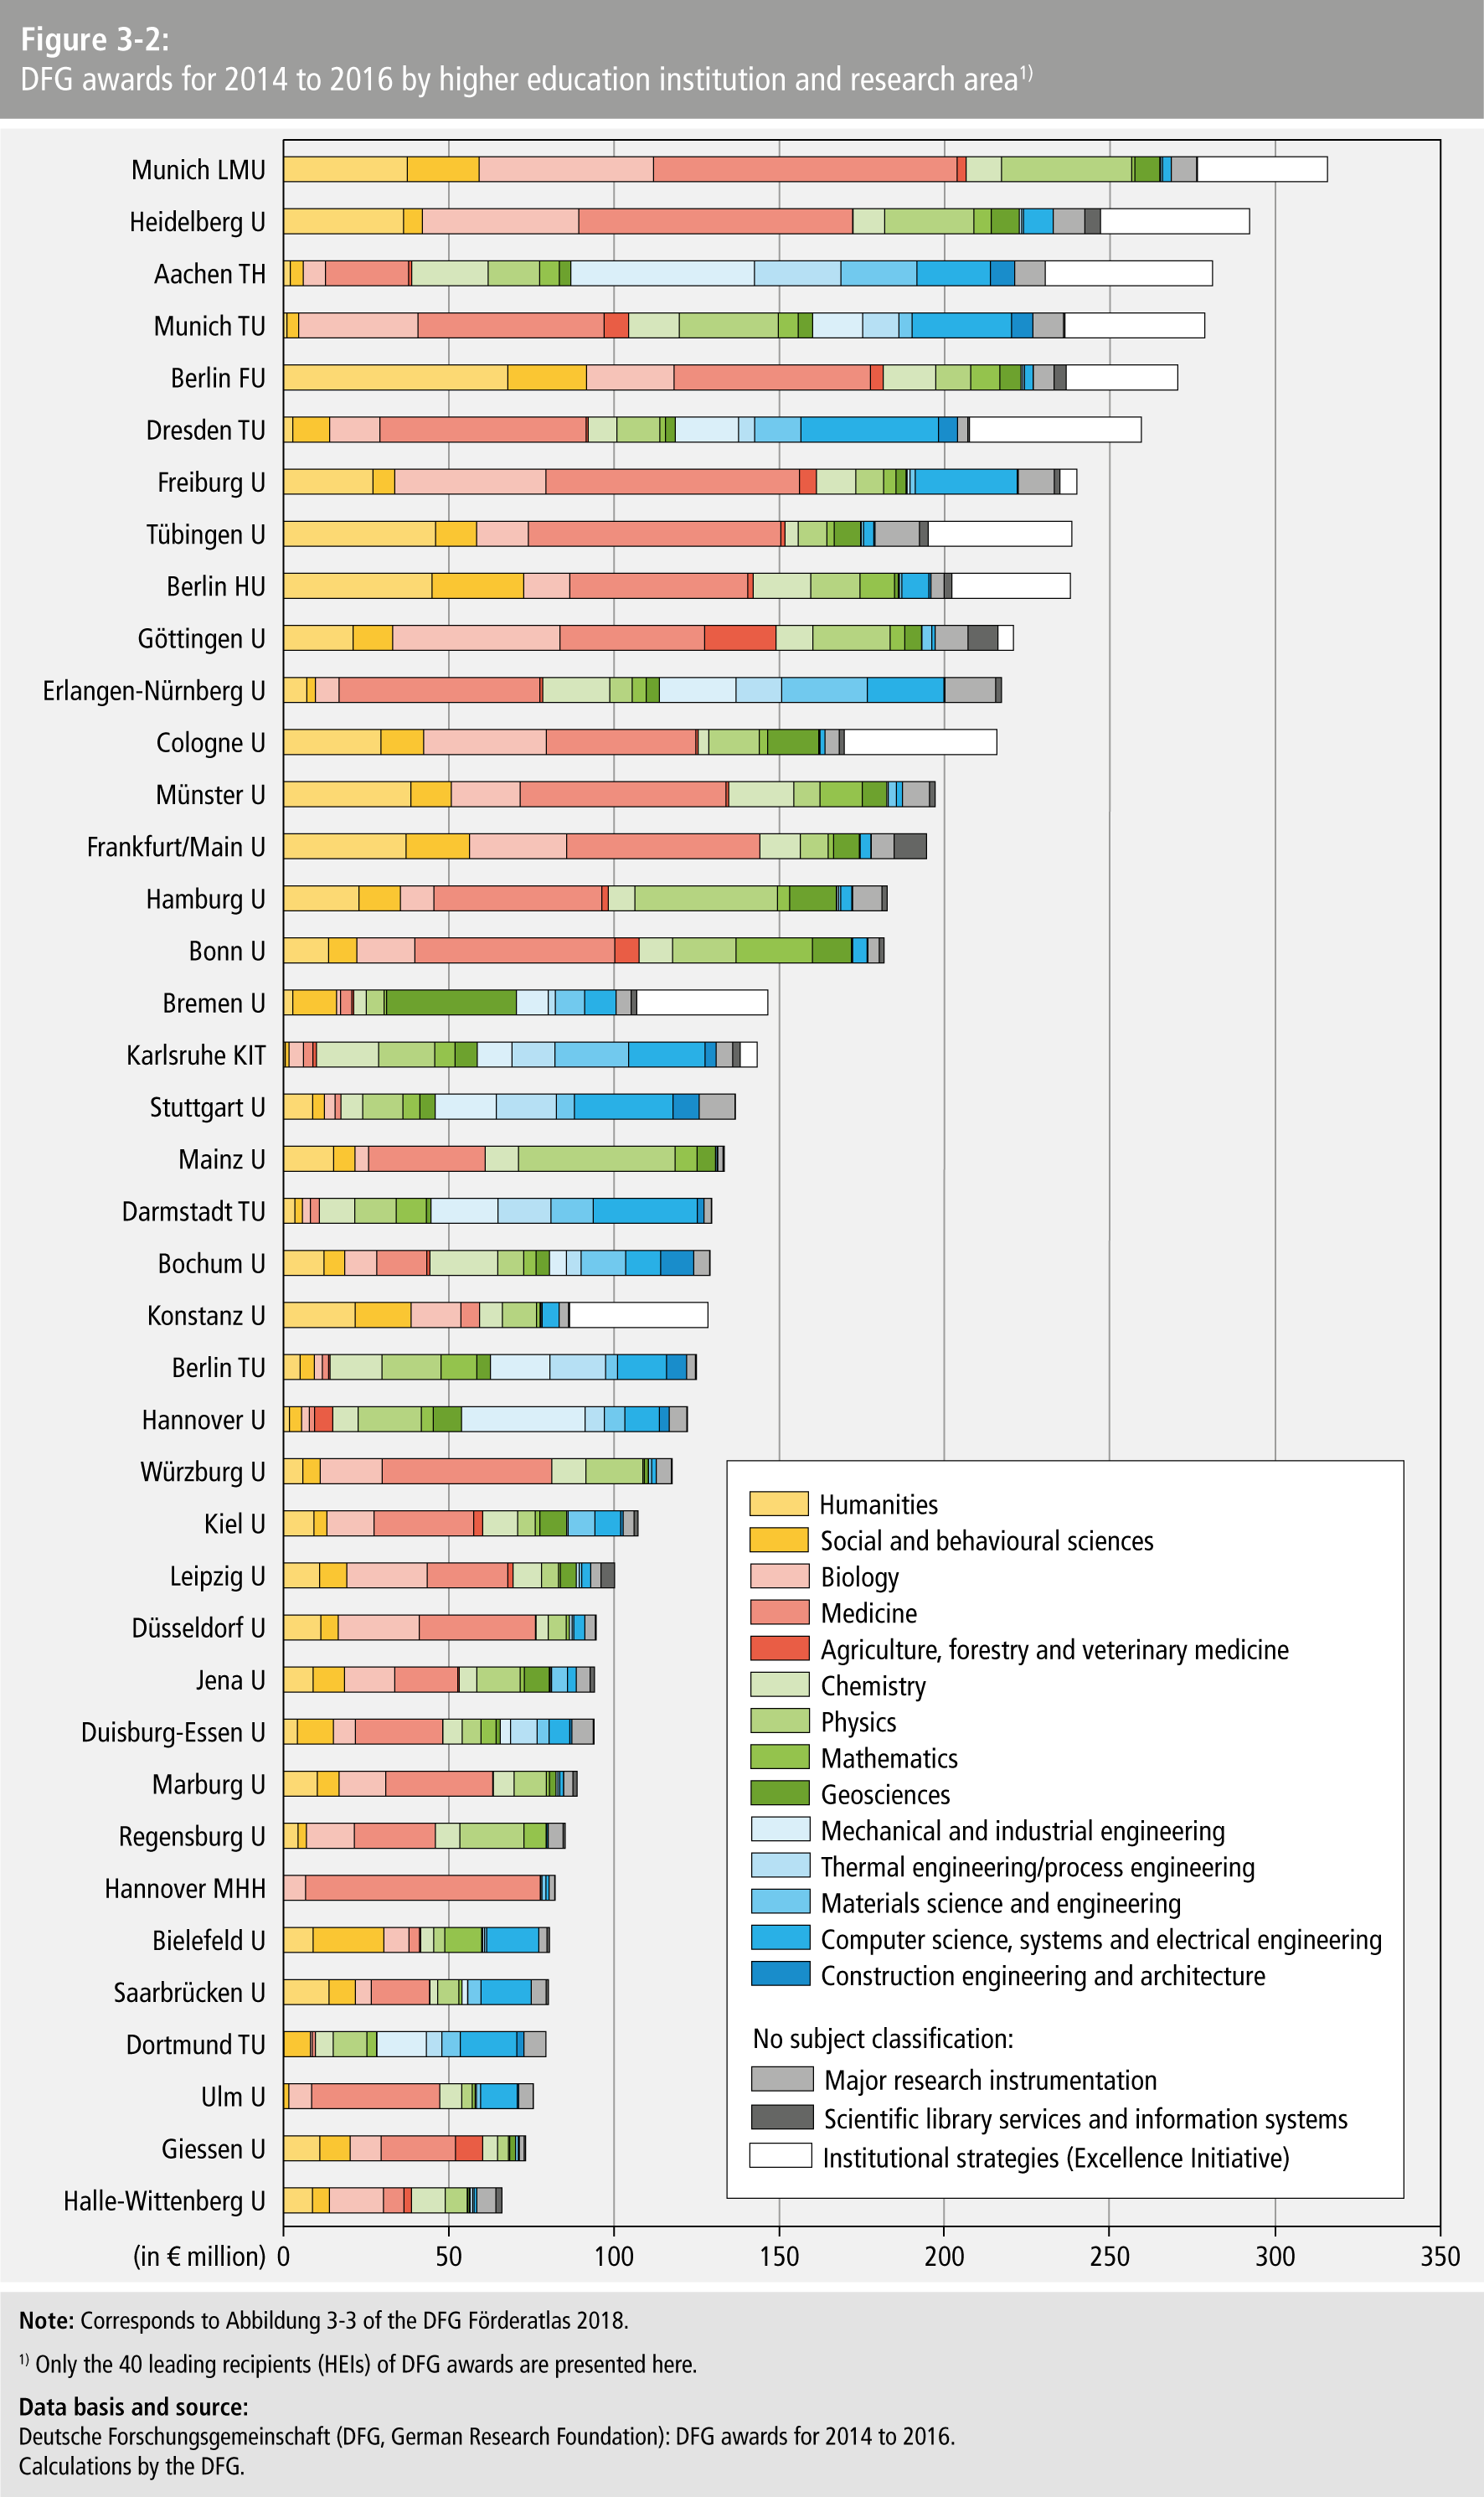
- Figure 3-2: DFG awards for 2014 to 2016 by higher education institution and research are
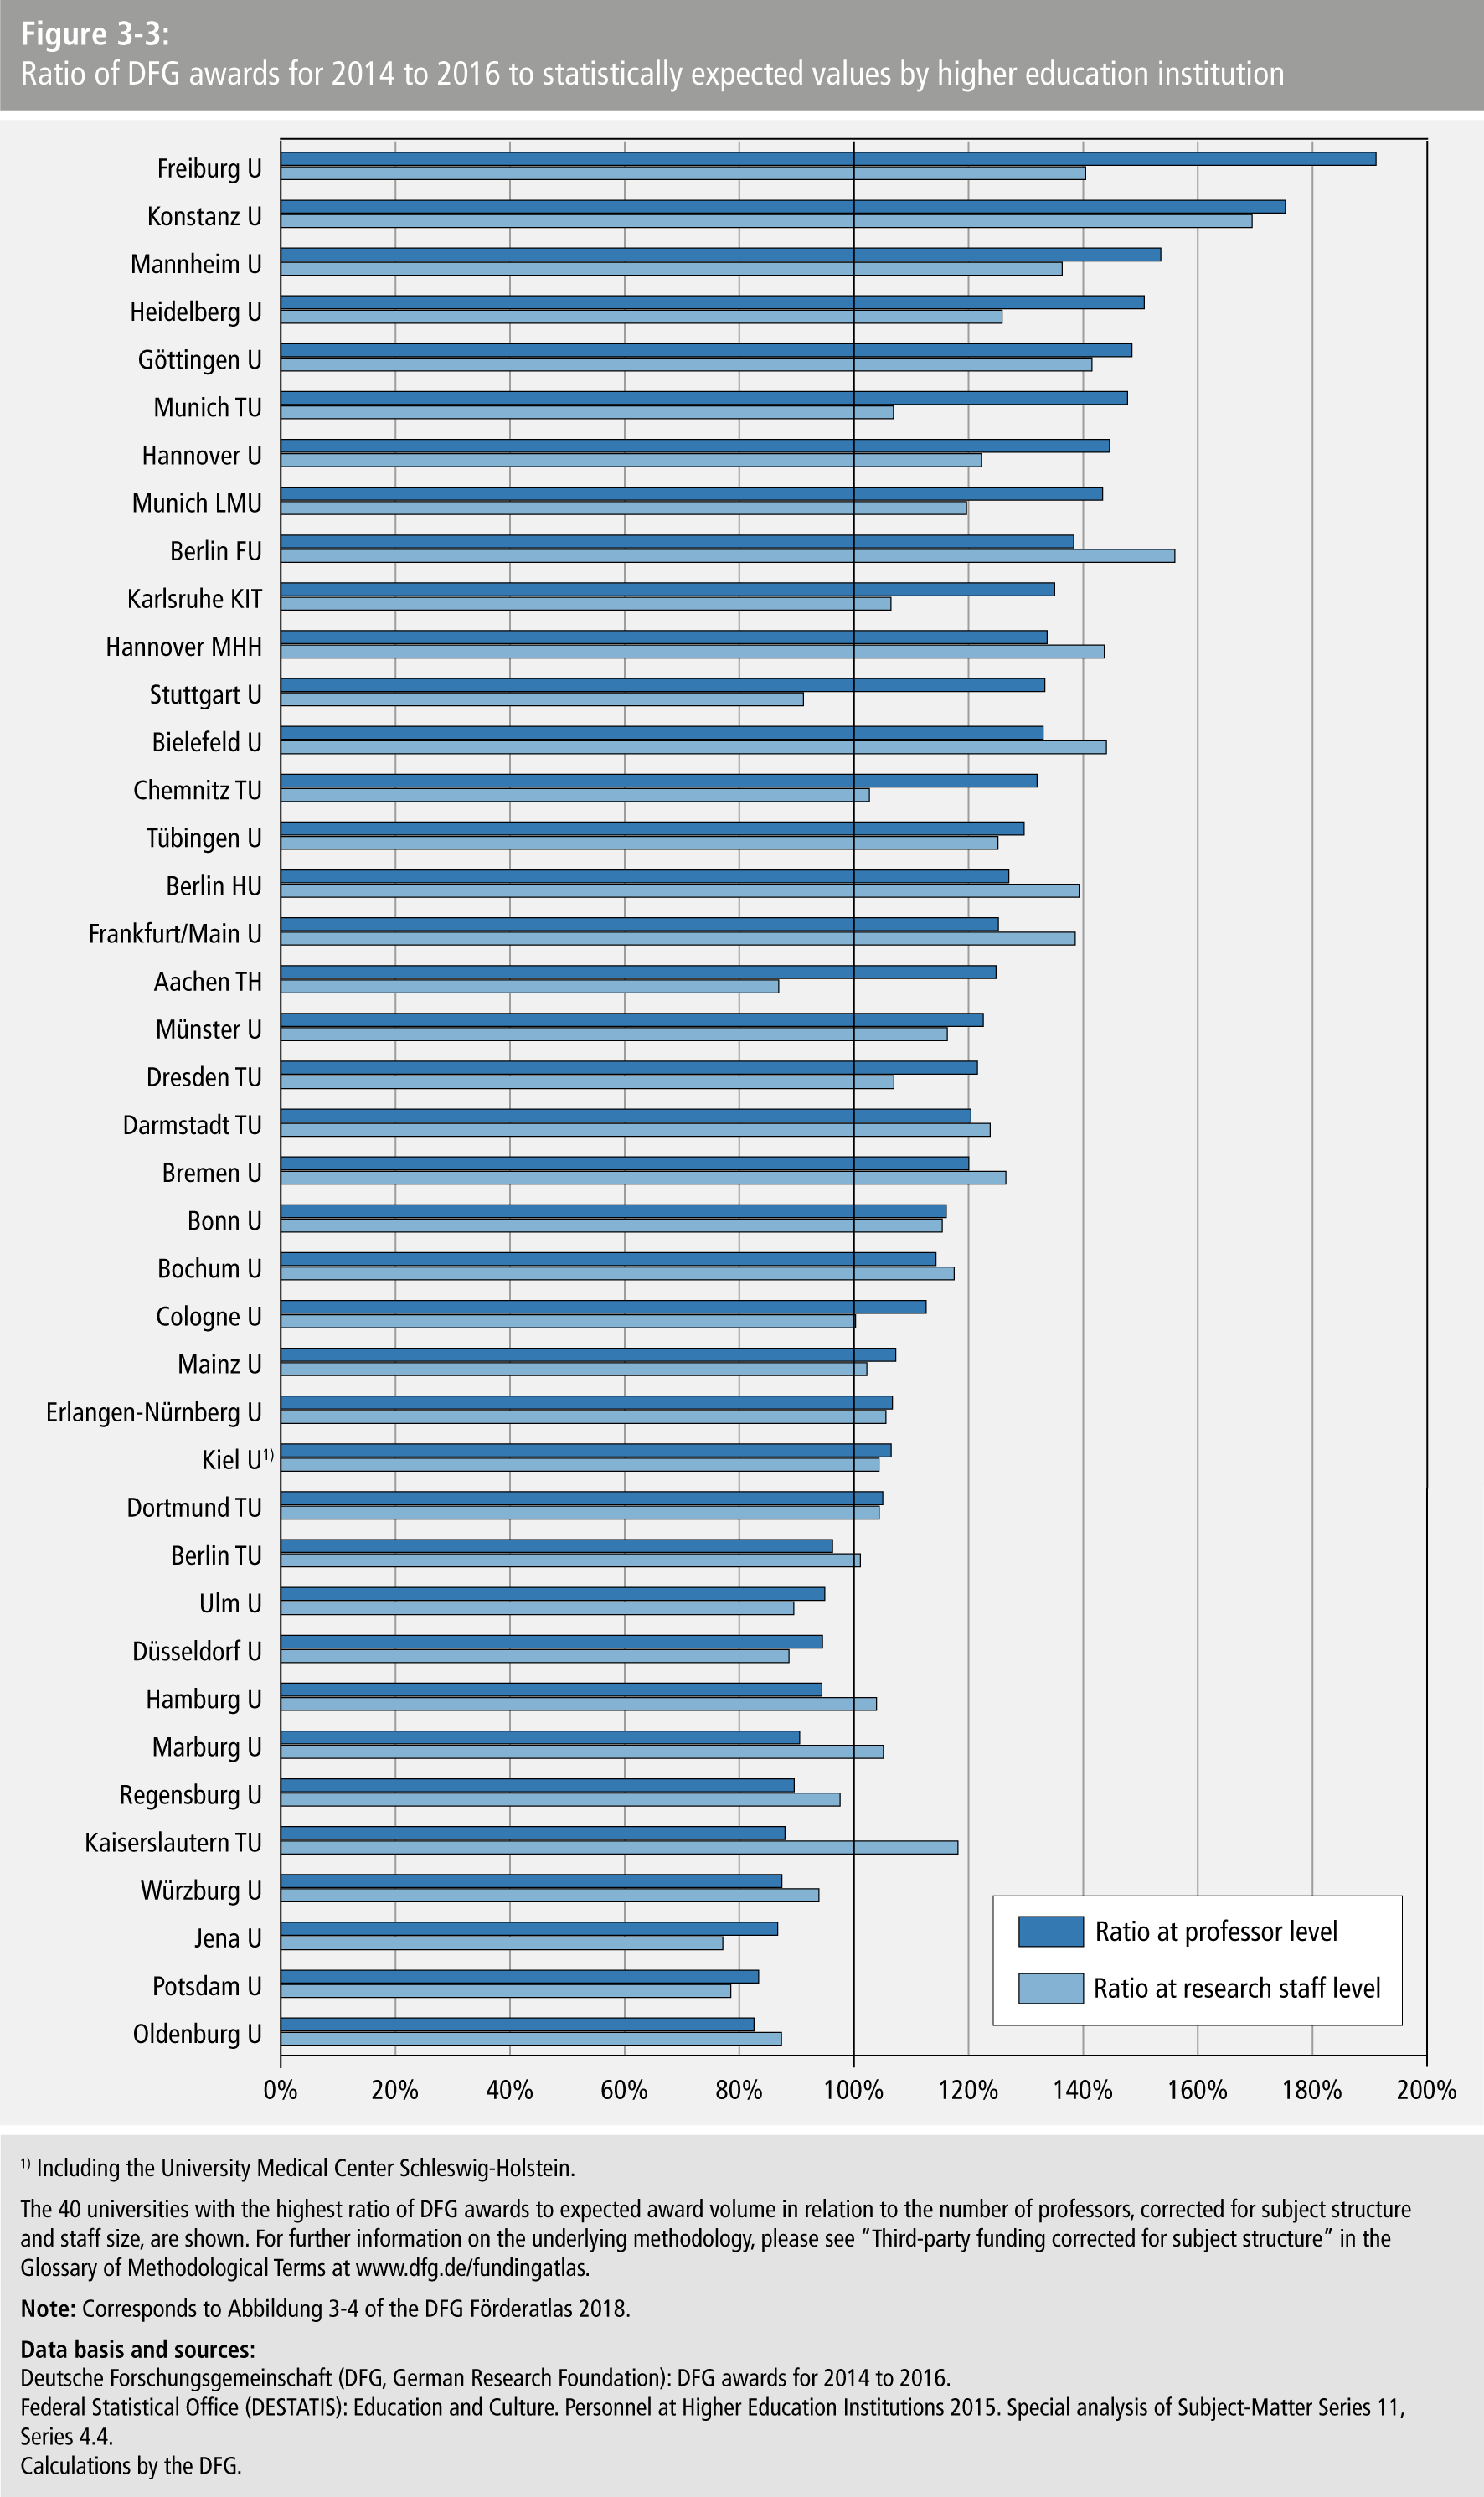
- Figure 3-3: Ratio of DFG awards for 2014 to 2016 to statistically expected values by higher education institutio
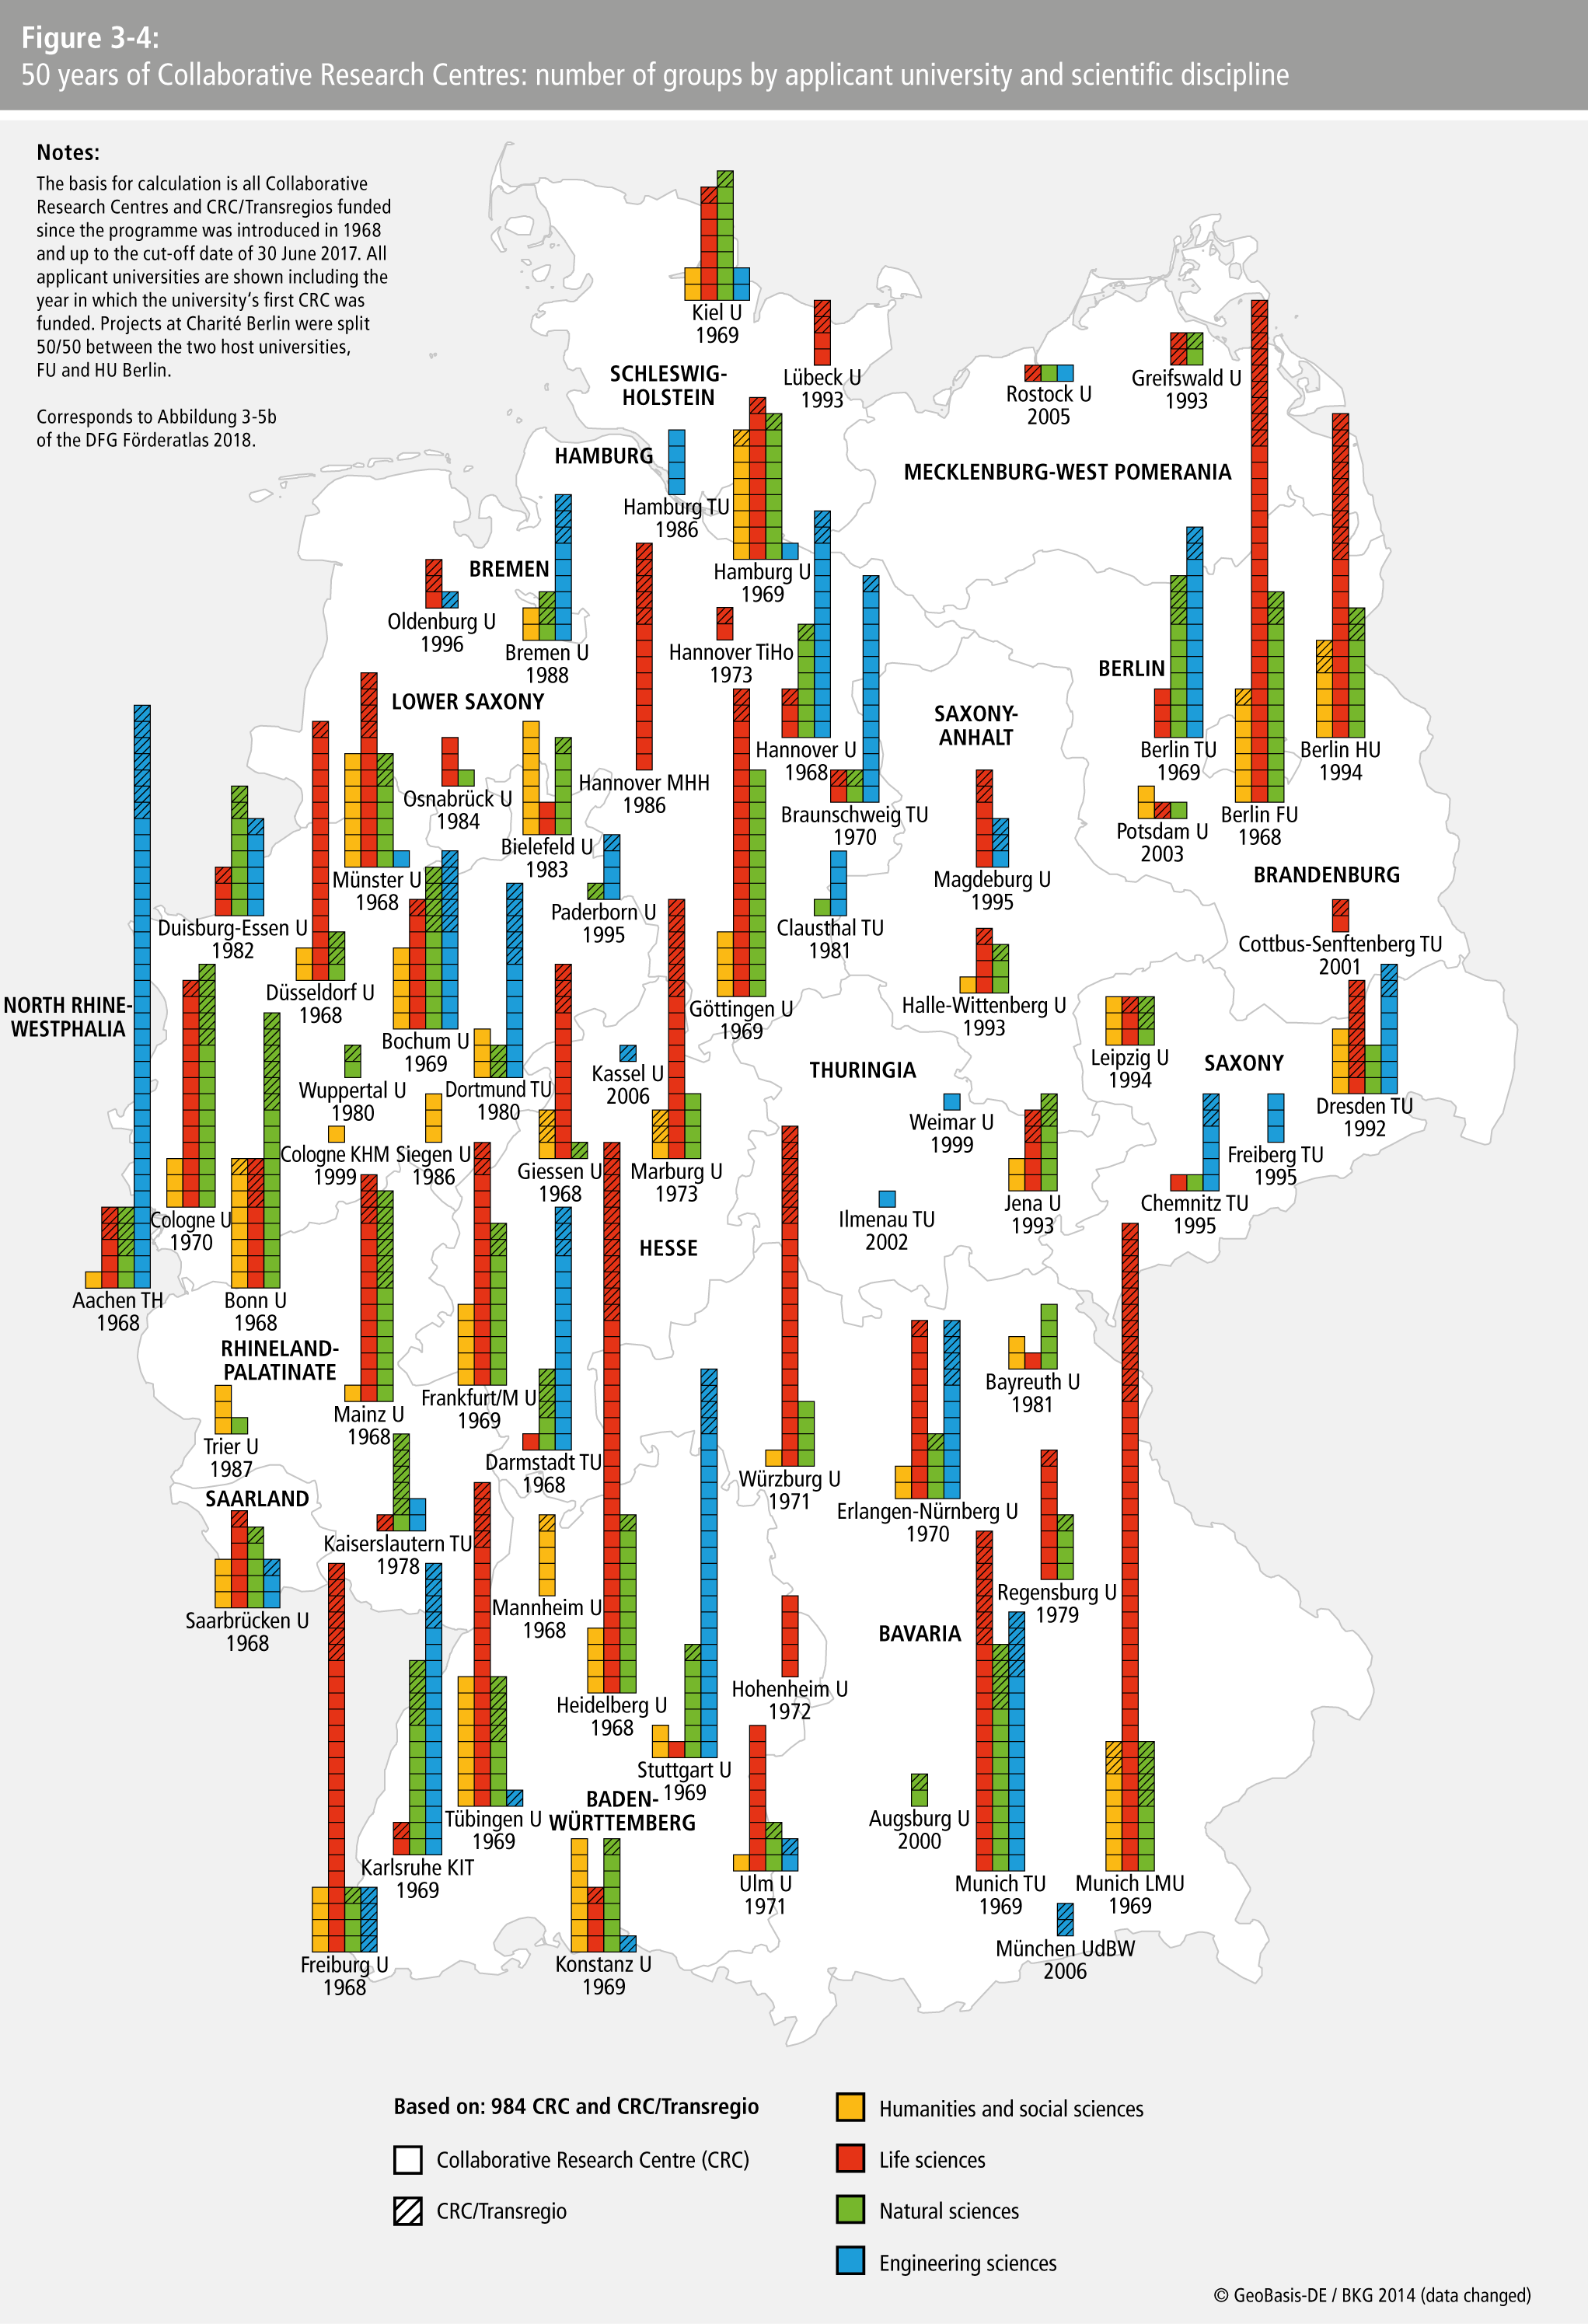
- Figure 3-4: 50 years of Collaborative Research Centres: number of groups by applicant university and scientific disciplin
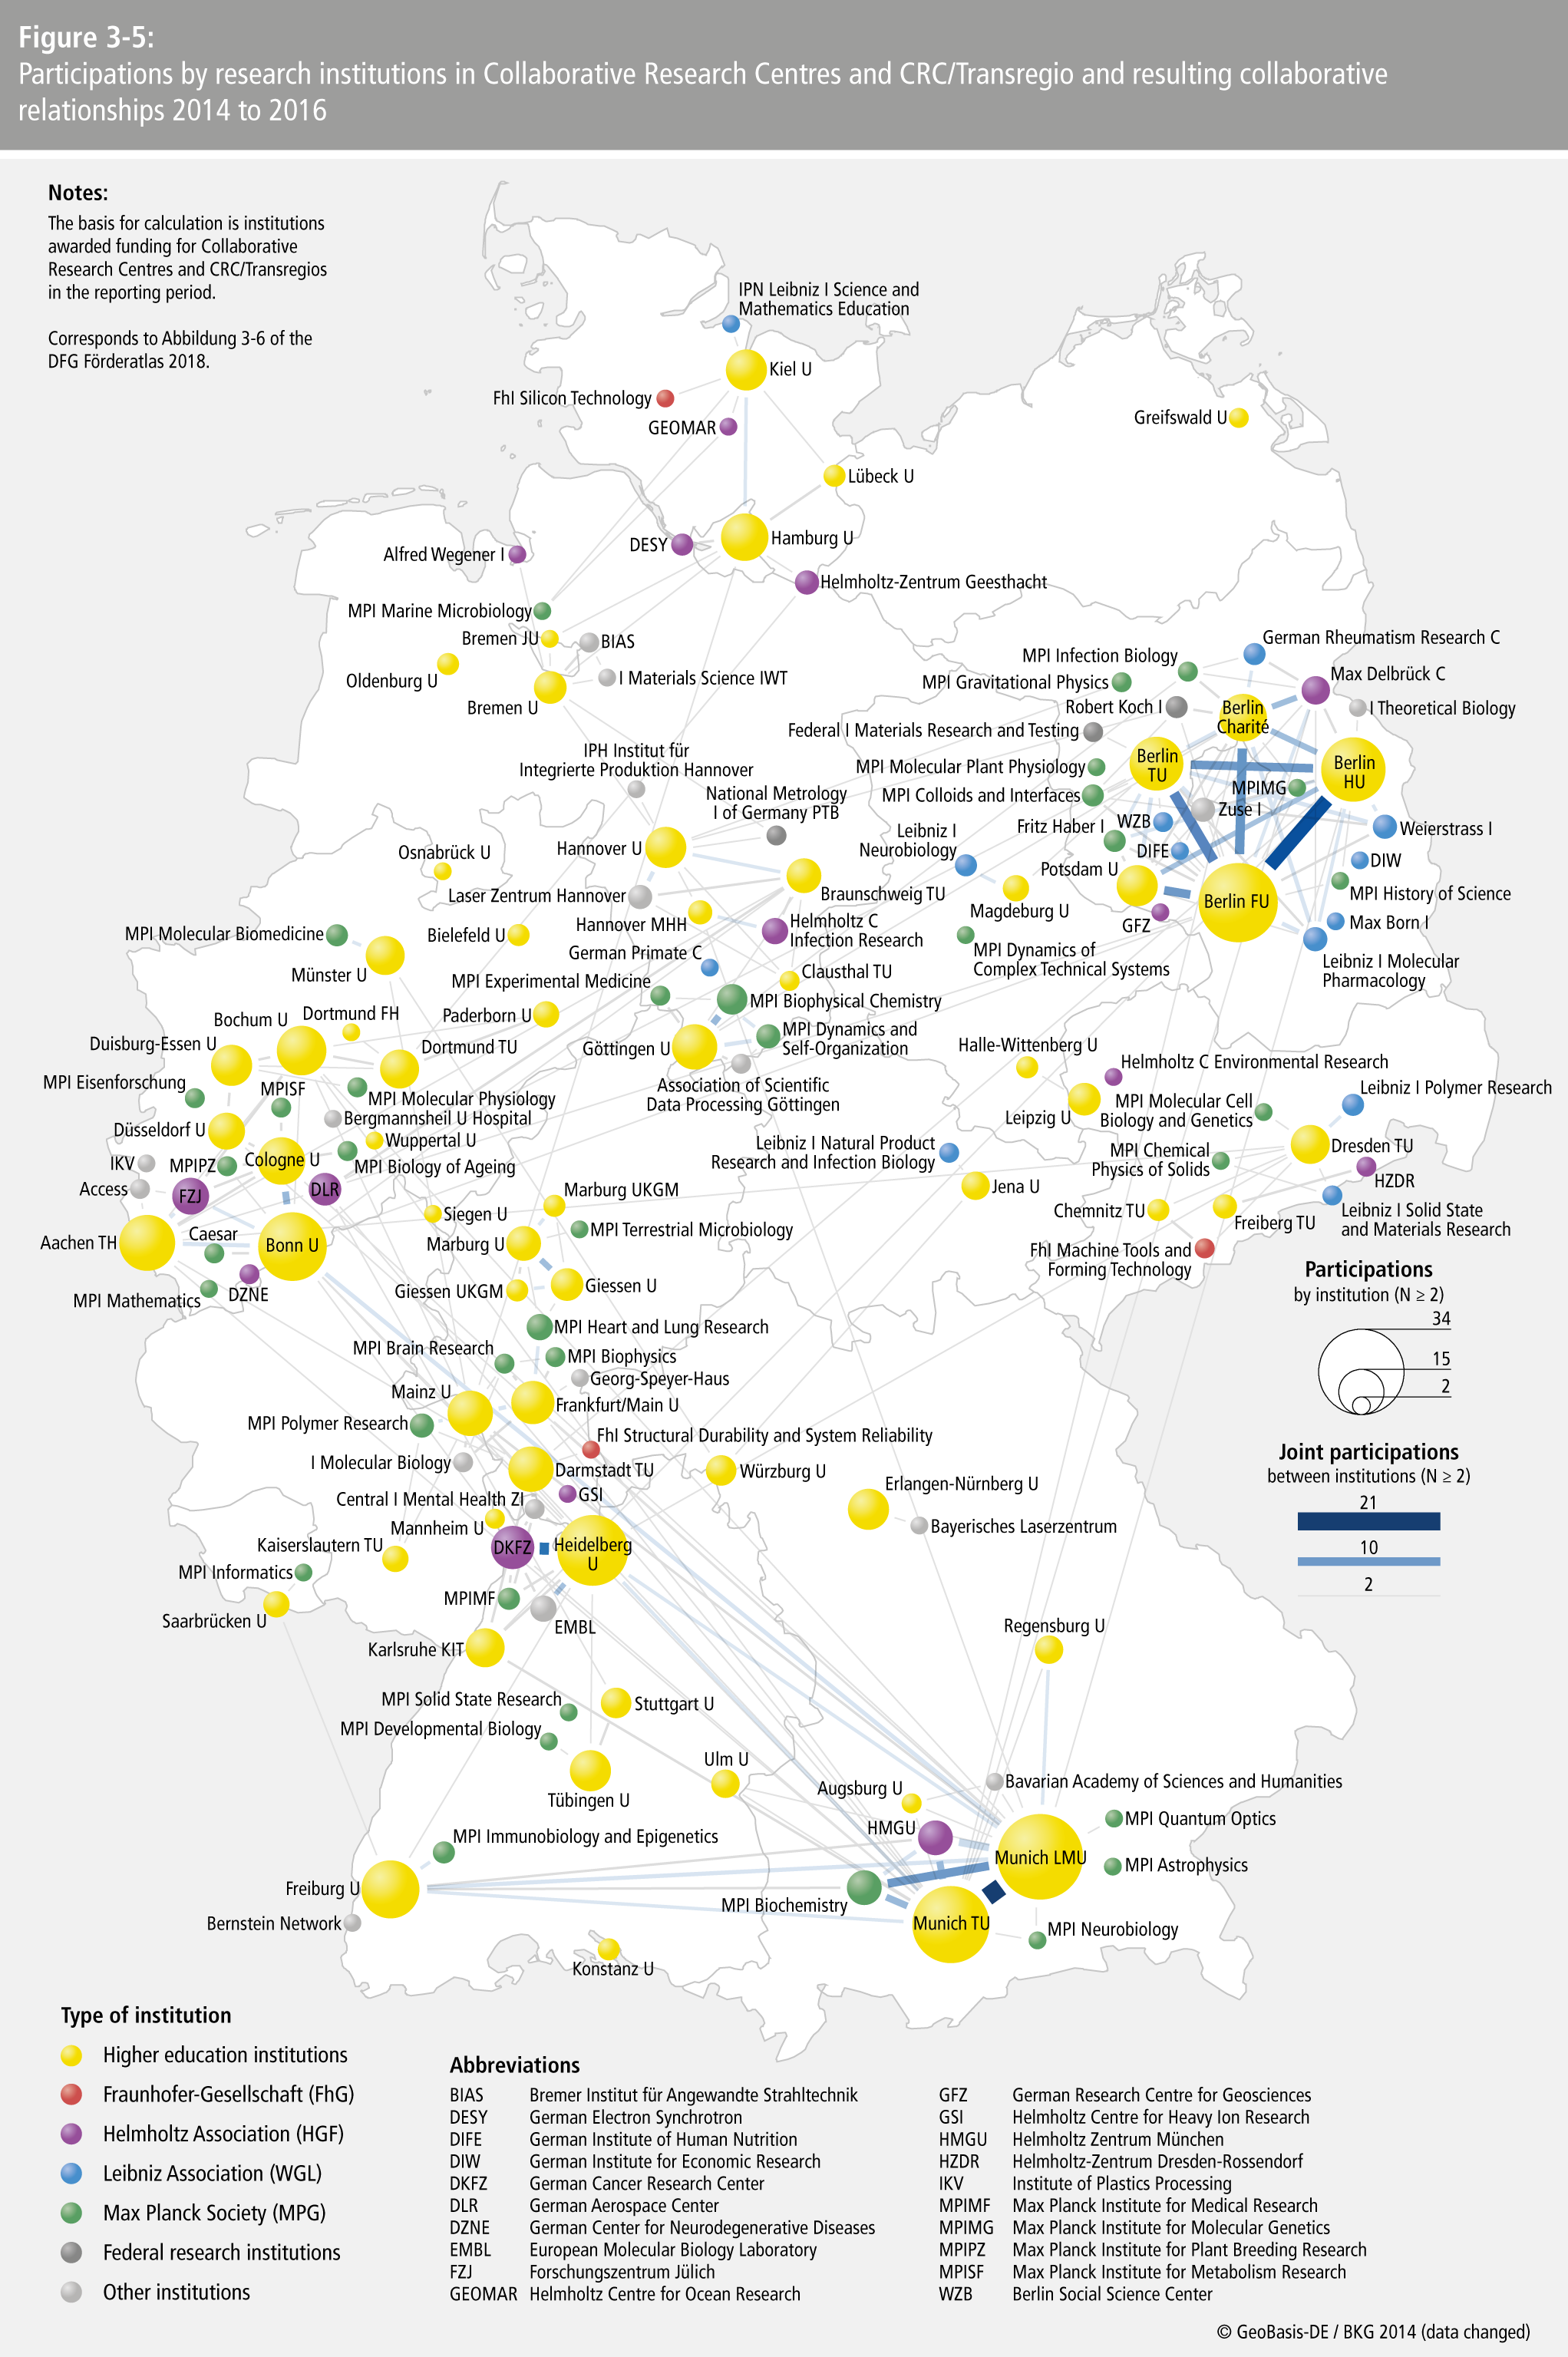
- Figure 3-5: Participations by research institutions in Collaborative Research Centres and CRC/Transregio and resulting collaborative relationships 2014 to 201
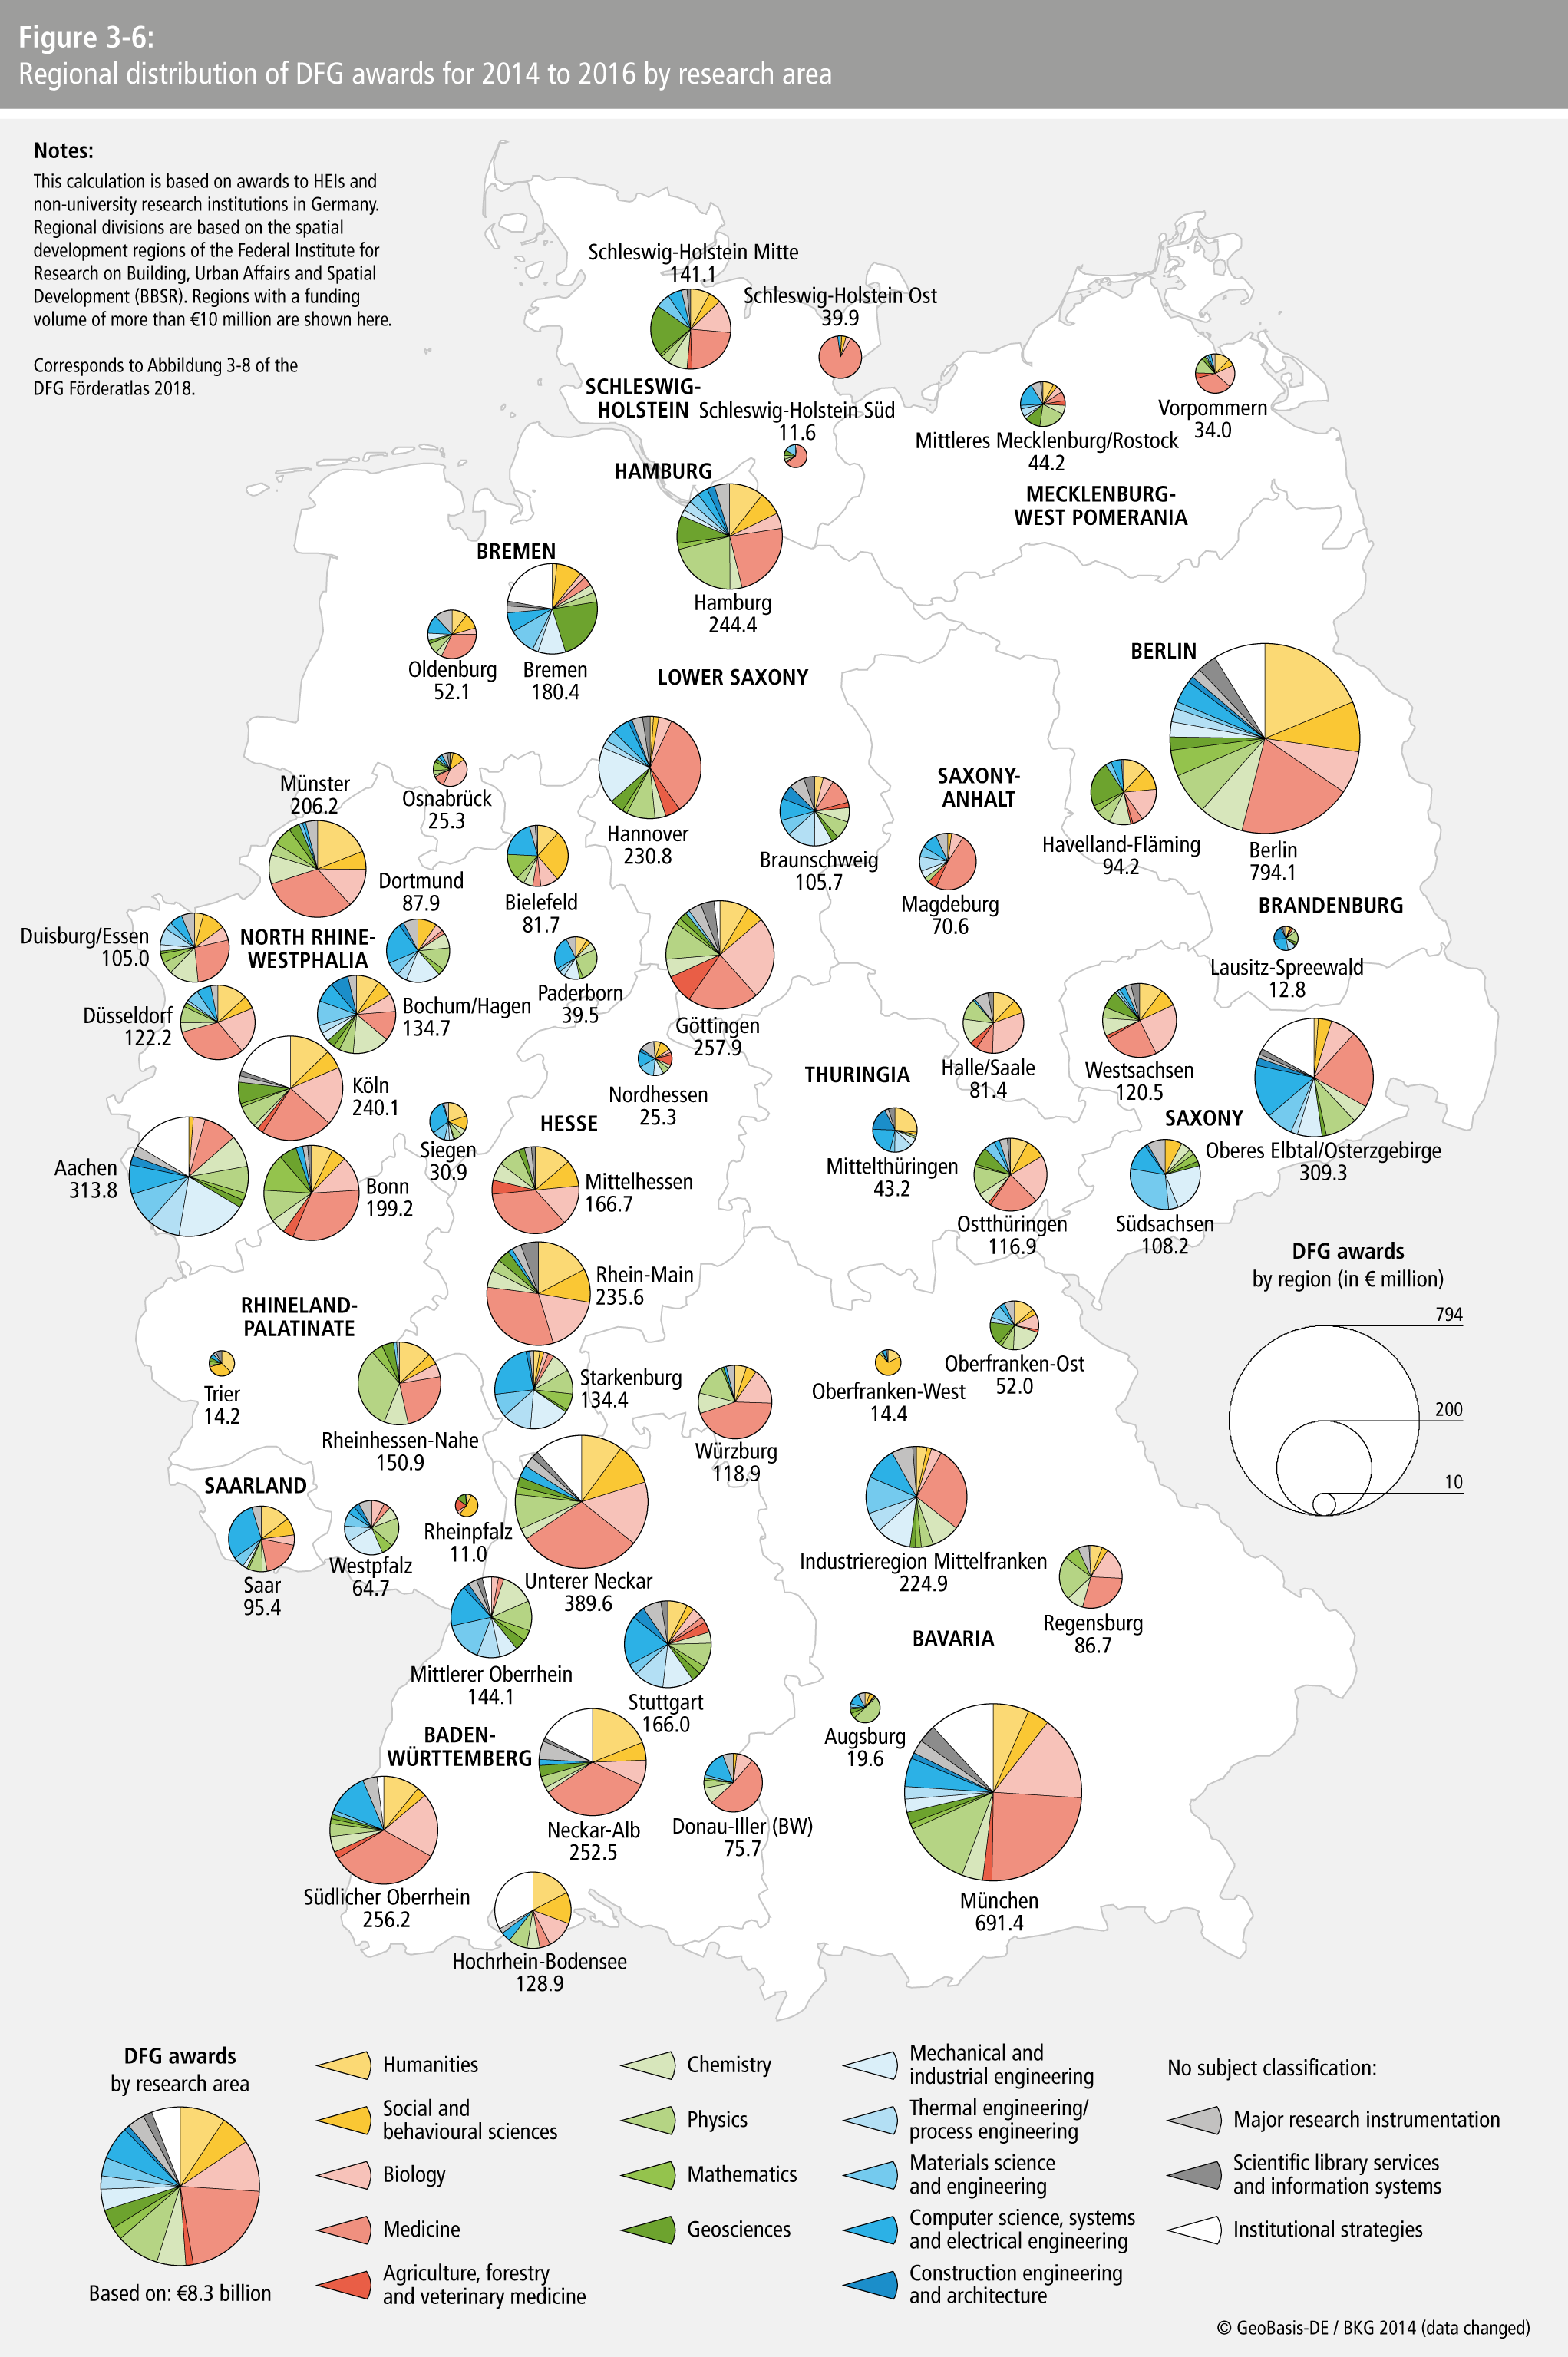
- Figure 3-6: Regional distribution of DFG awards for 2014 to 2016 by research are
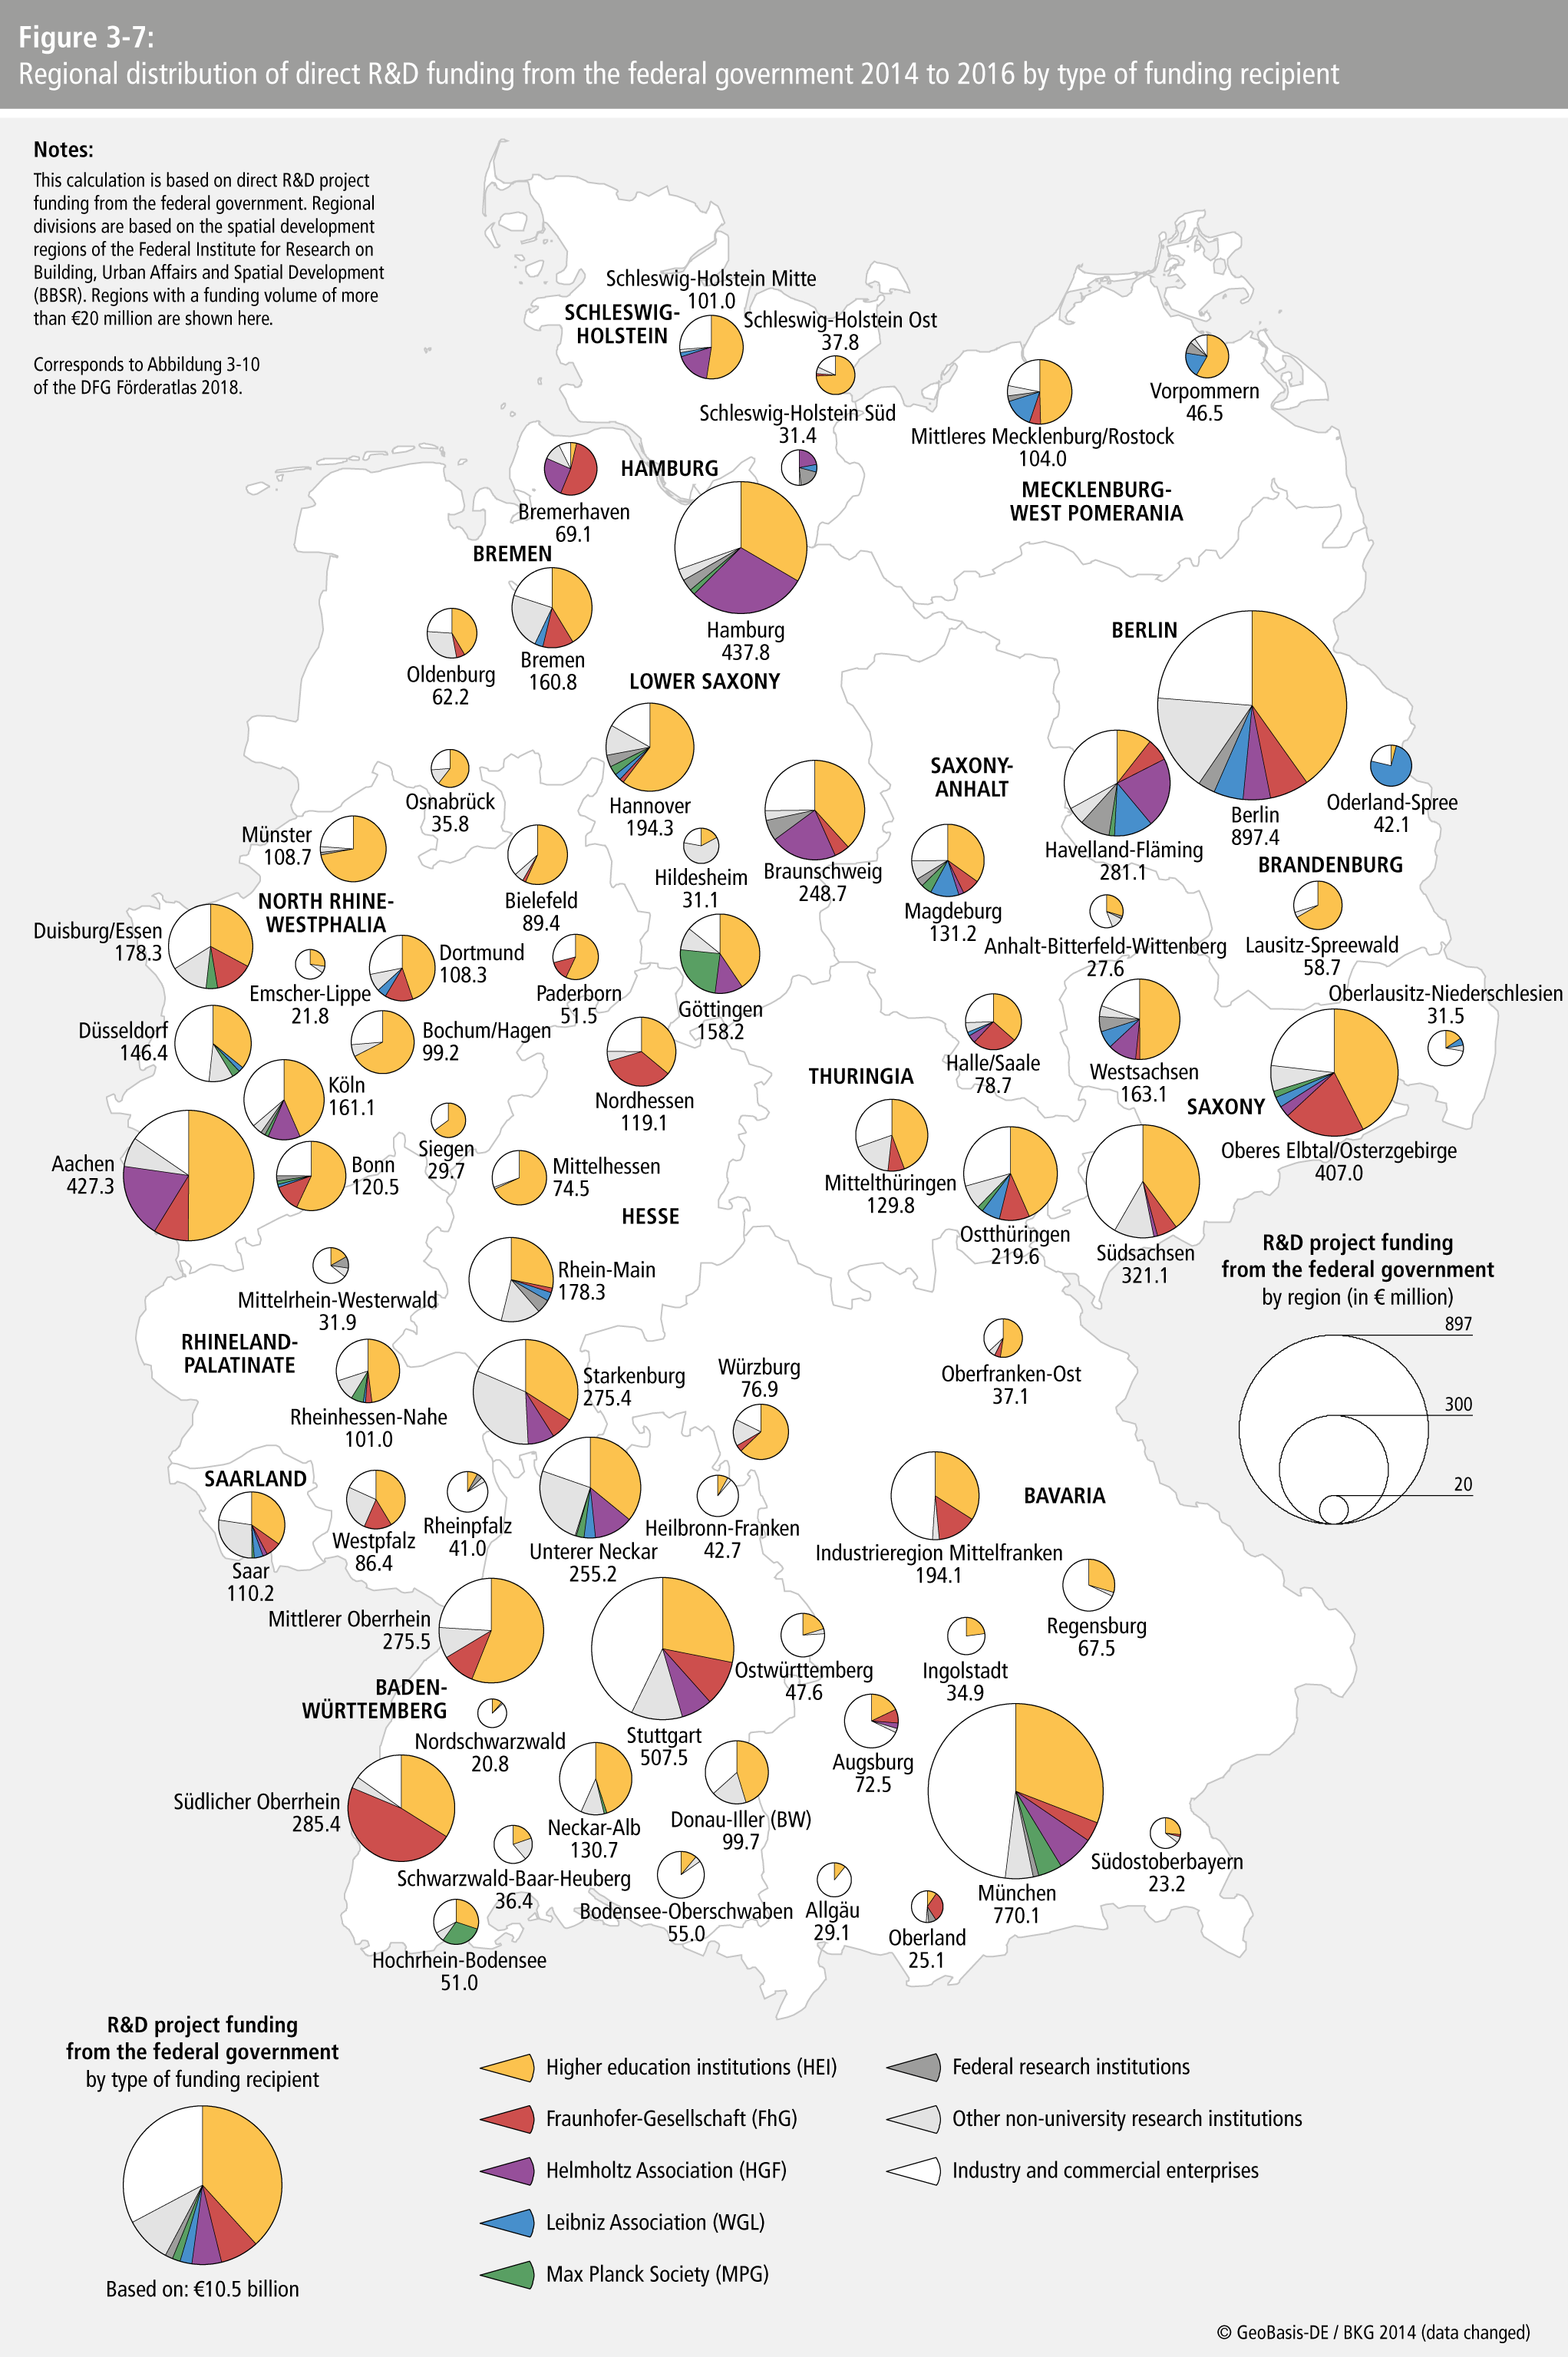
- Figure 3-7: Regional distribution of direct R&D funding from the federal government 2014 to 2016 by type of funding recipien
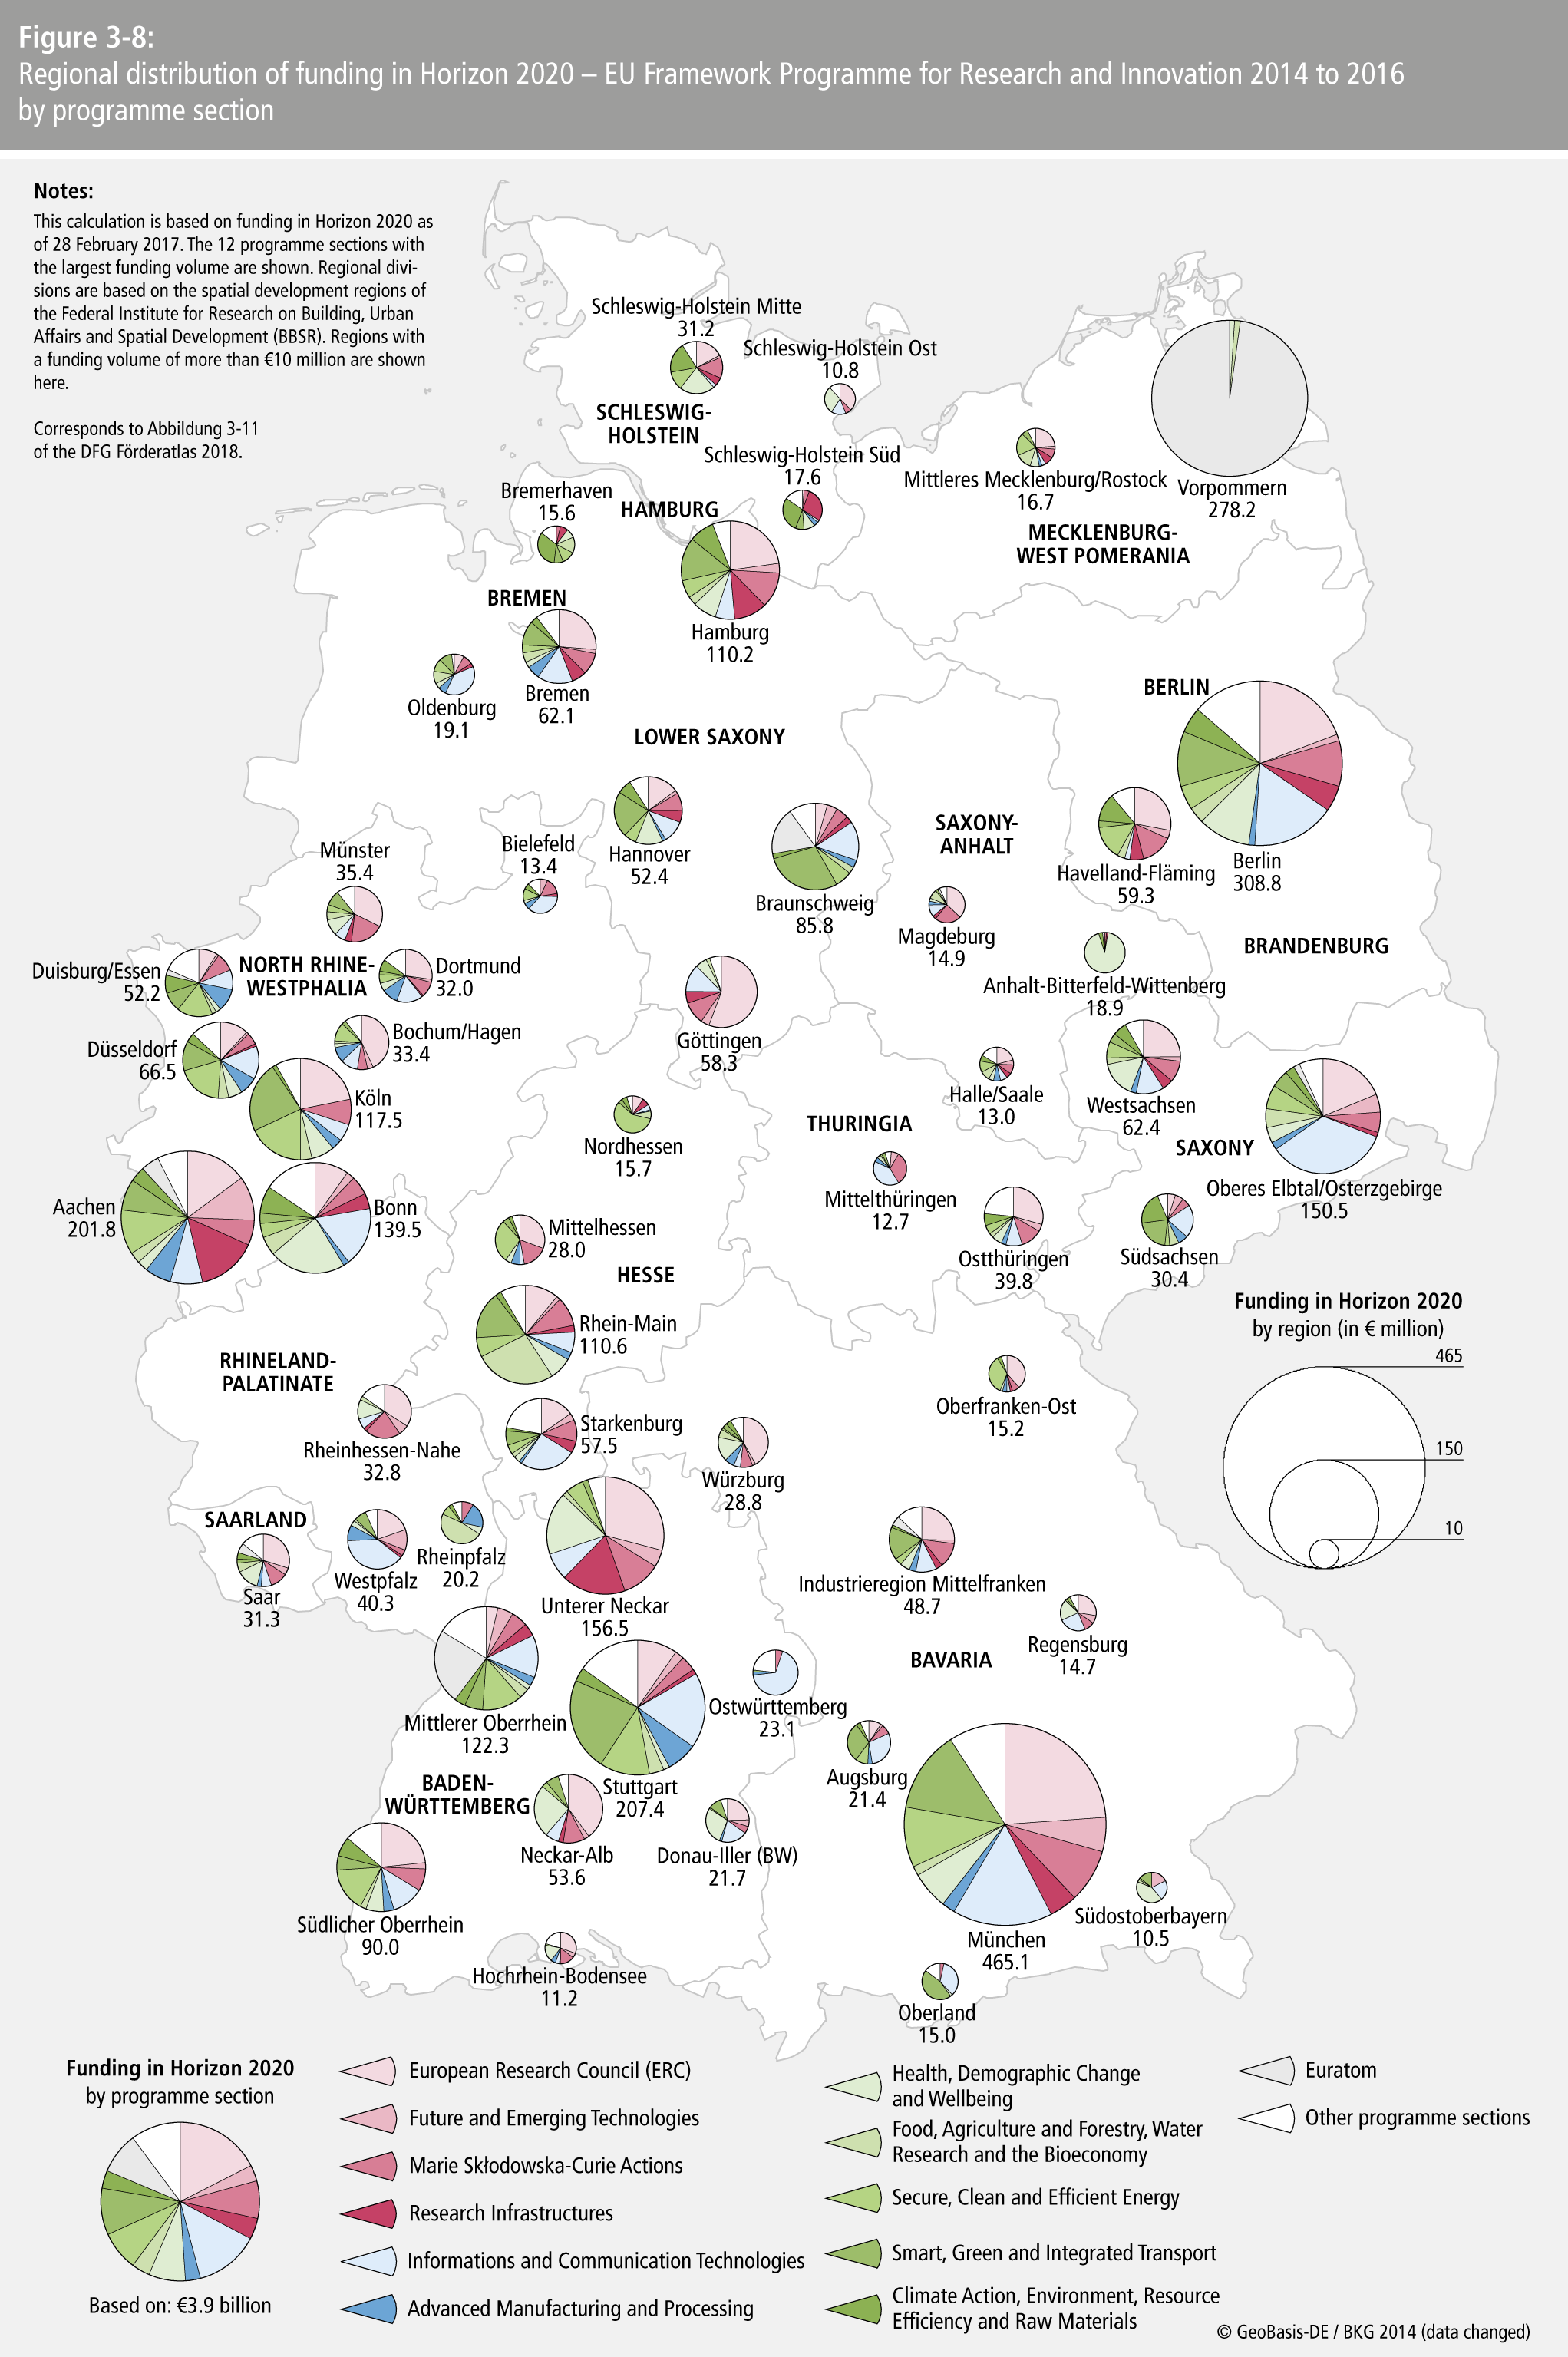
- Figure 3-8: Regional distribution of funding in Horizon 2020 – EU Framework Programme for Research and Innovation 2014 to 2016 by programme sectio
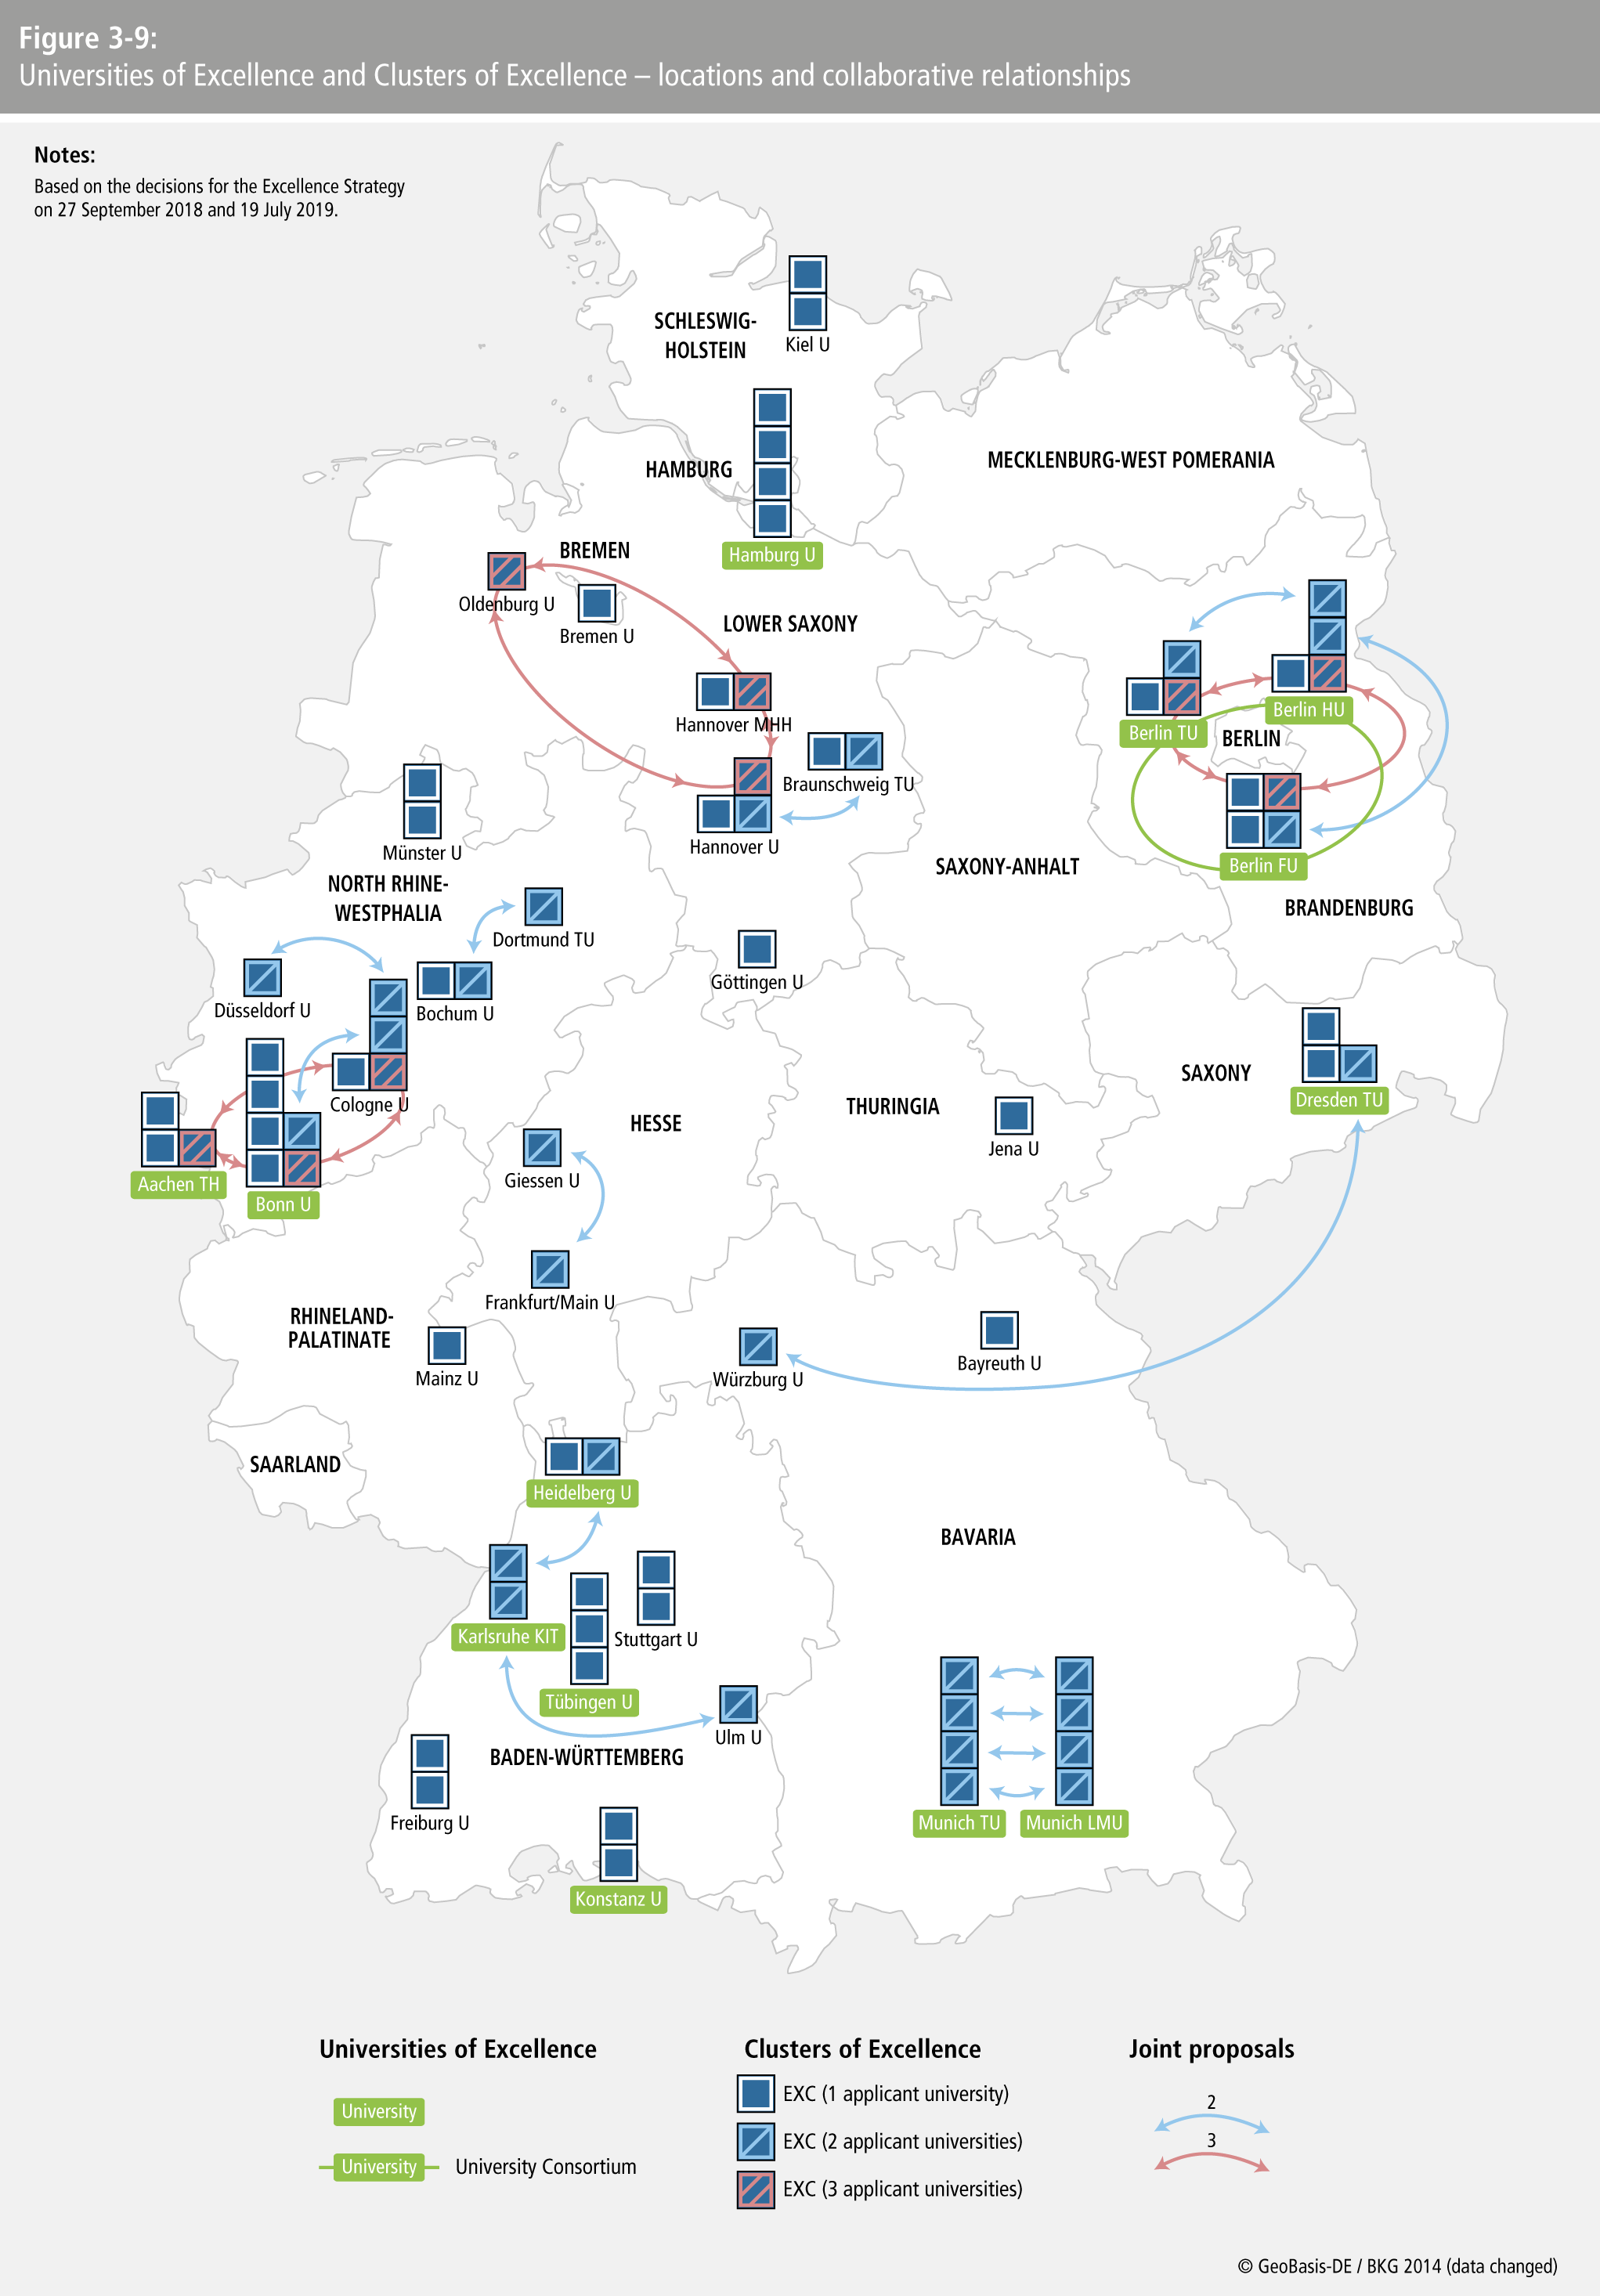
- Figure 3-9: Universities of Excellence and Clusters of Excellence – locations and collaborative relationship
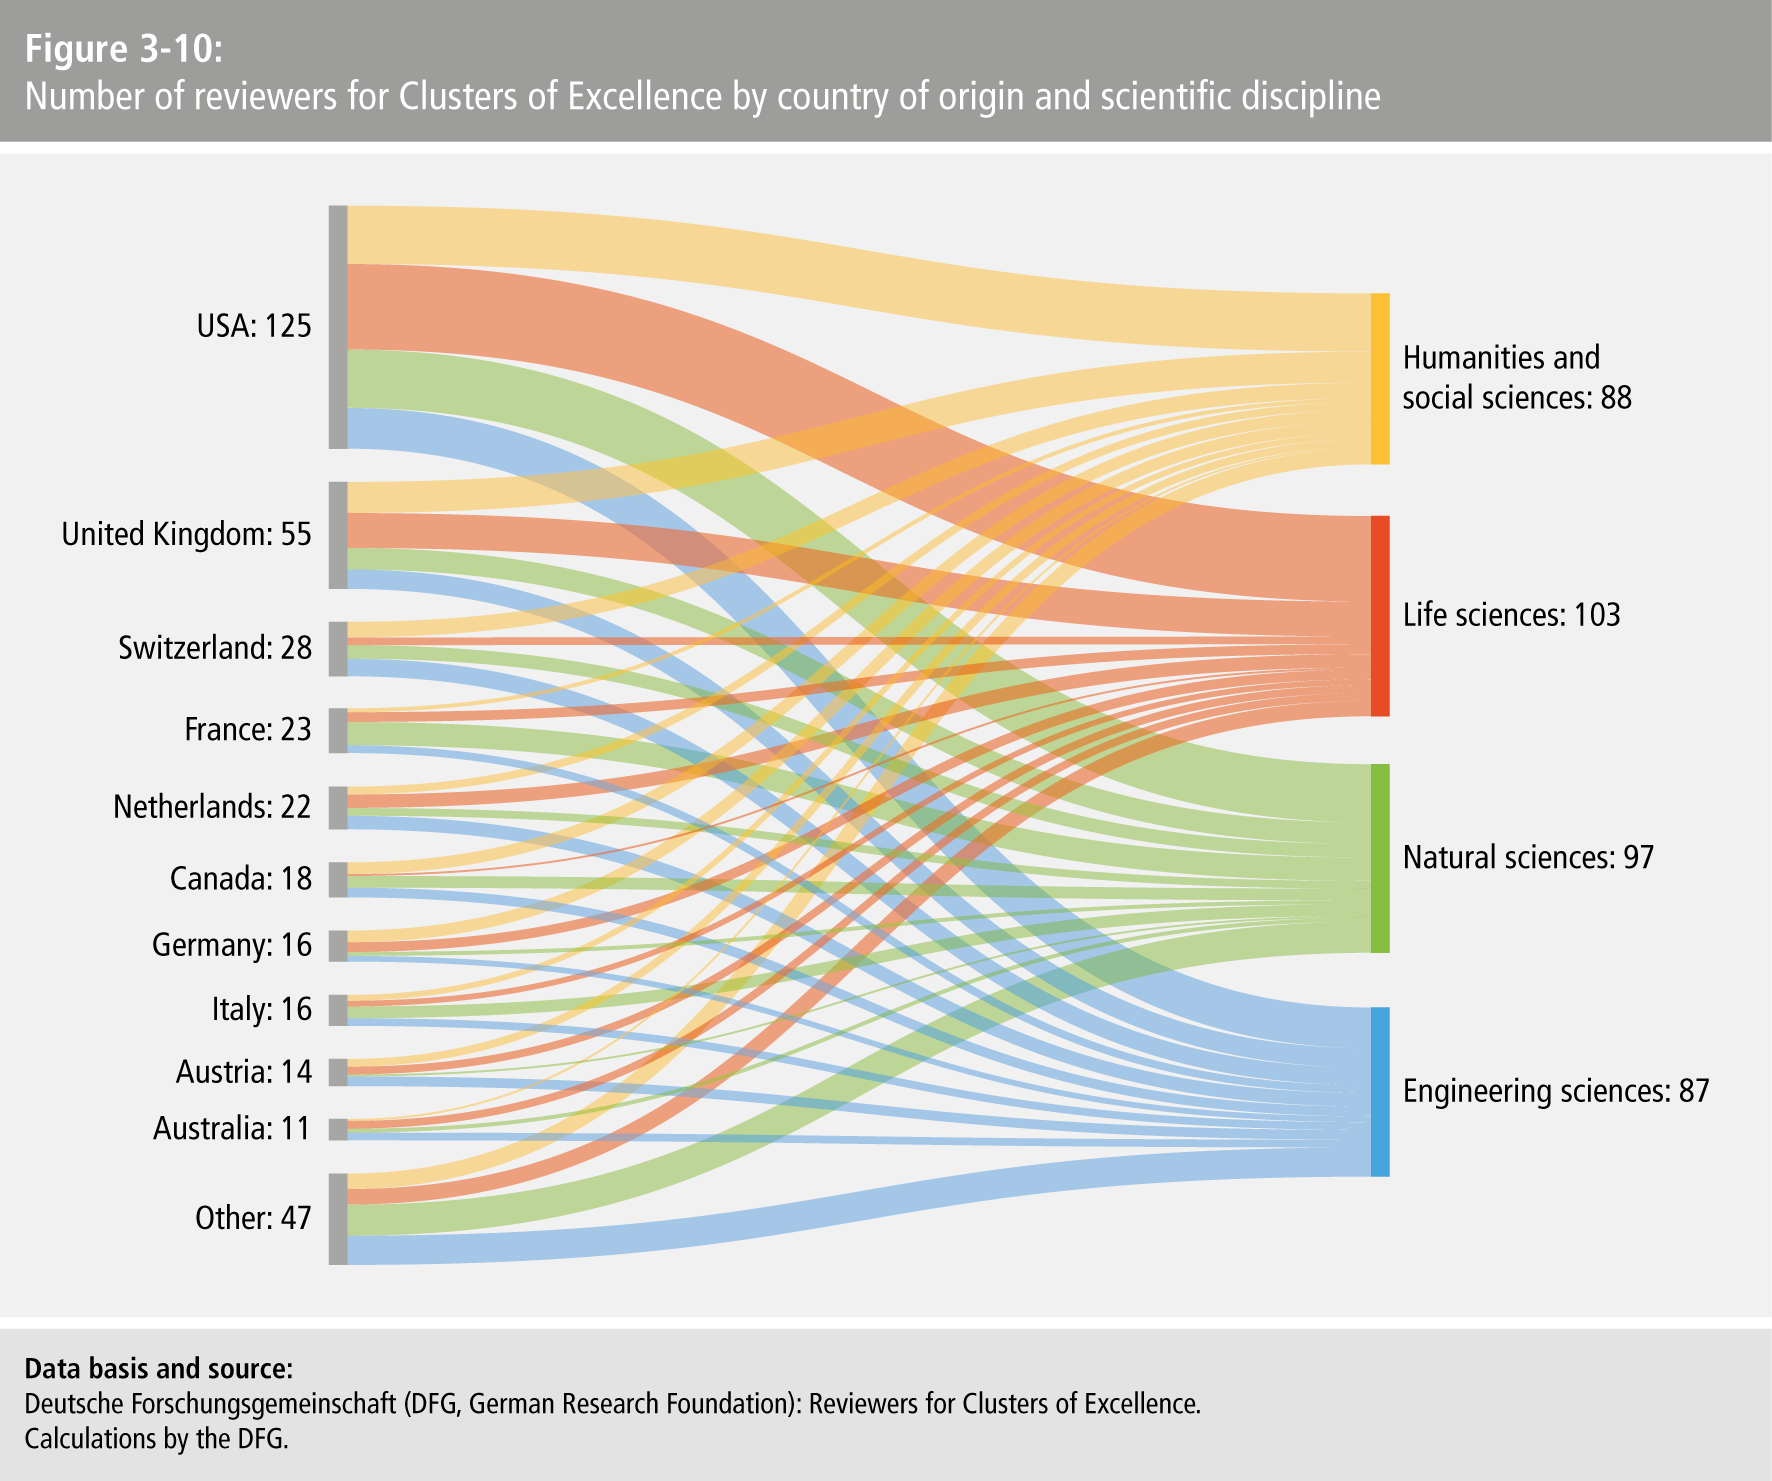
- Figure 3-10: Number of reviewers for Clusters of Excellence by country of origin and scientific disciplin
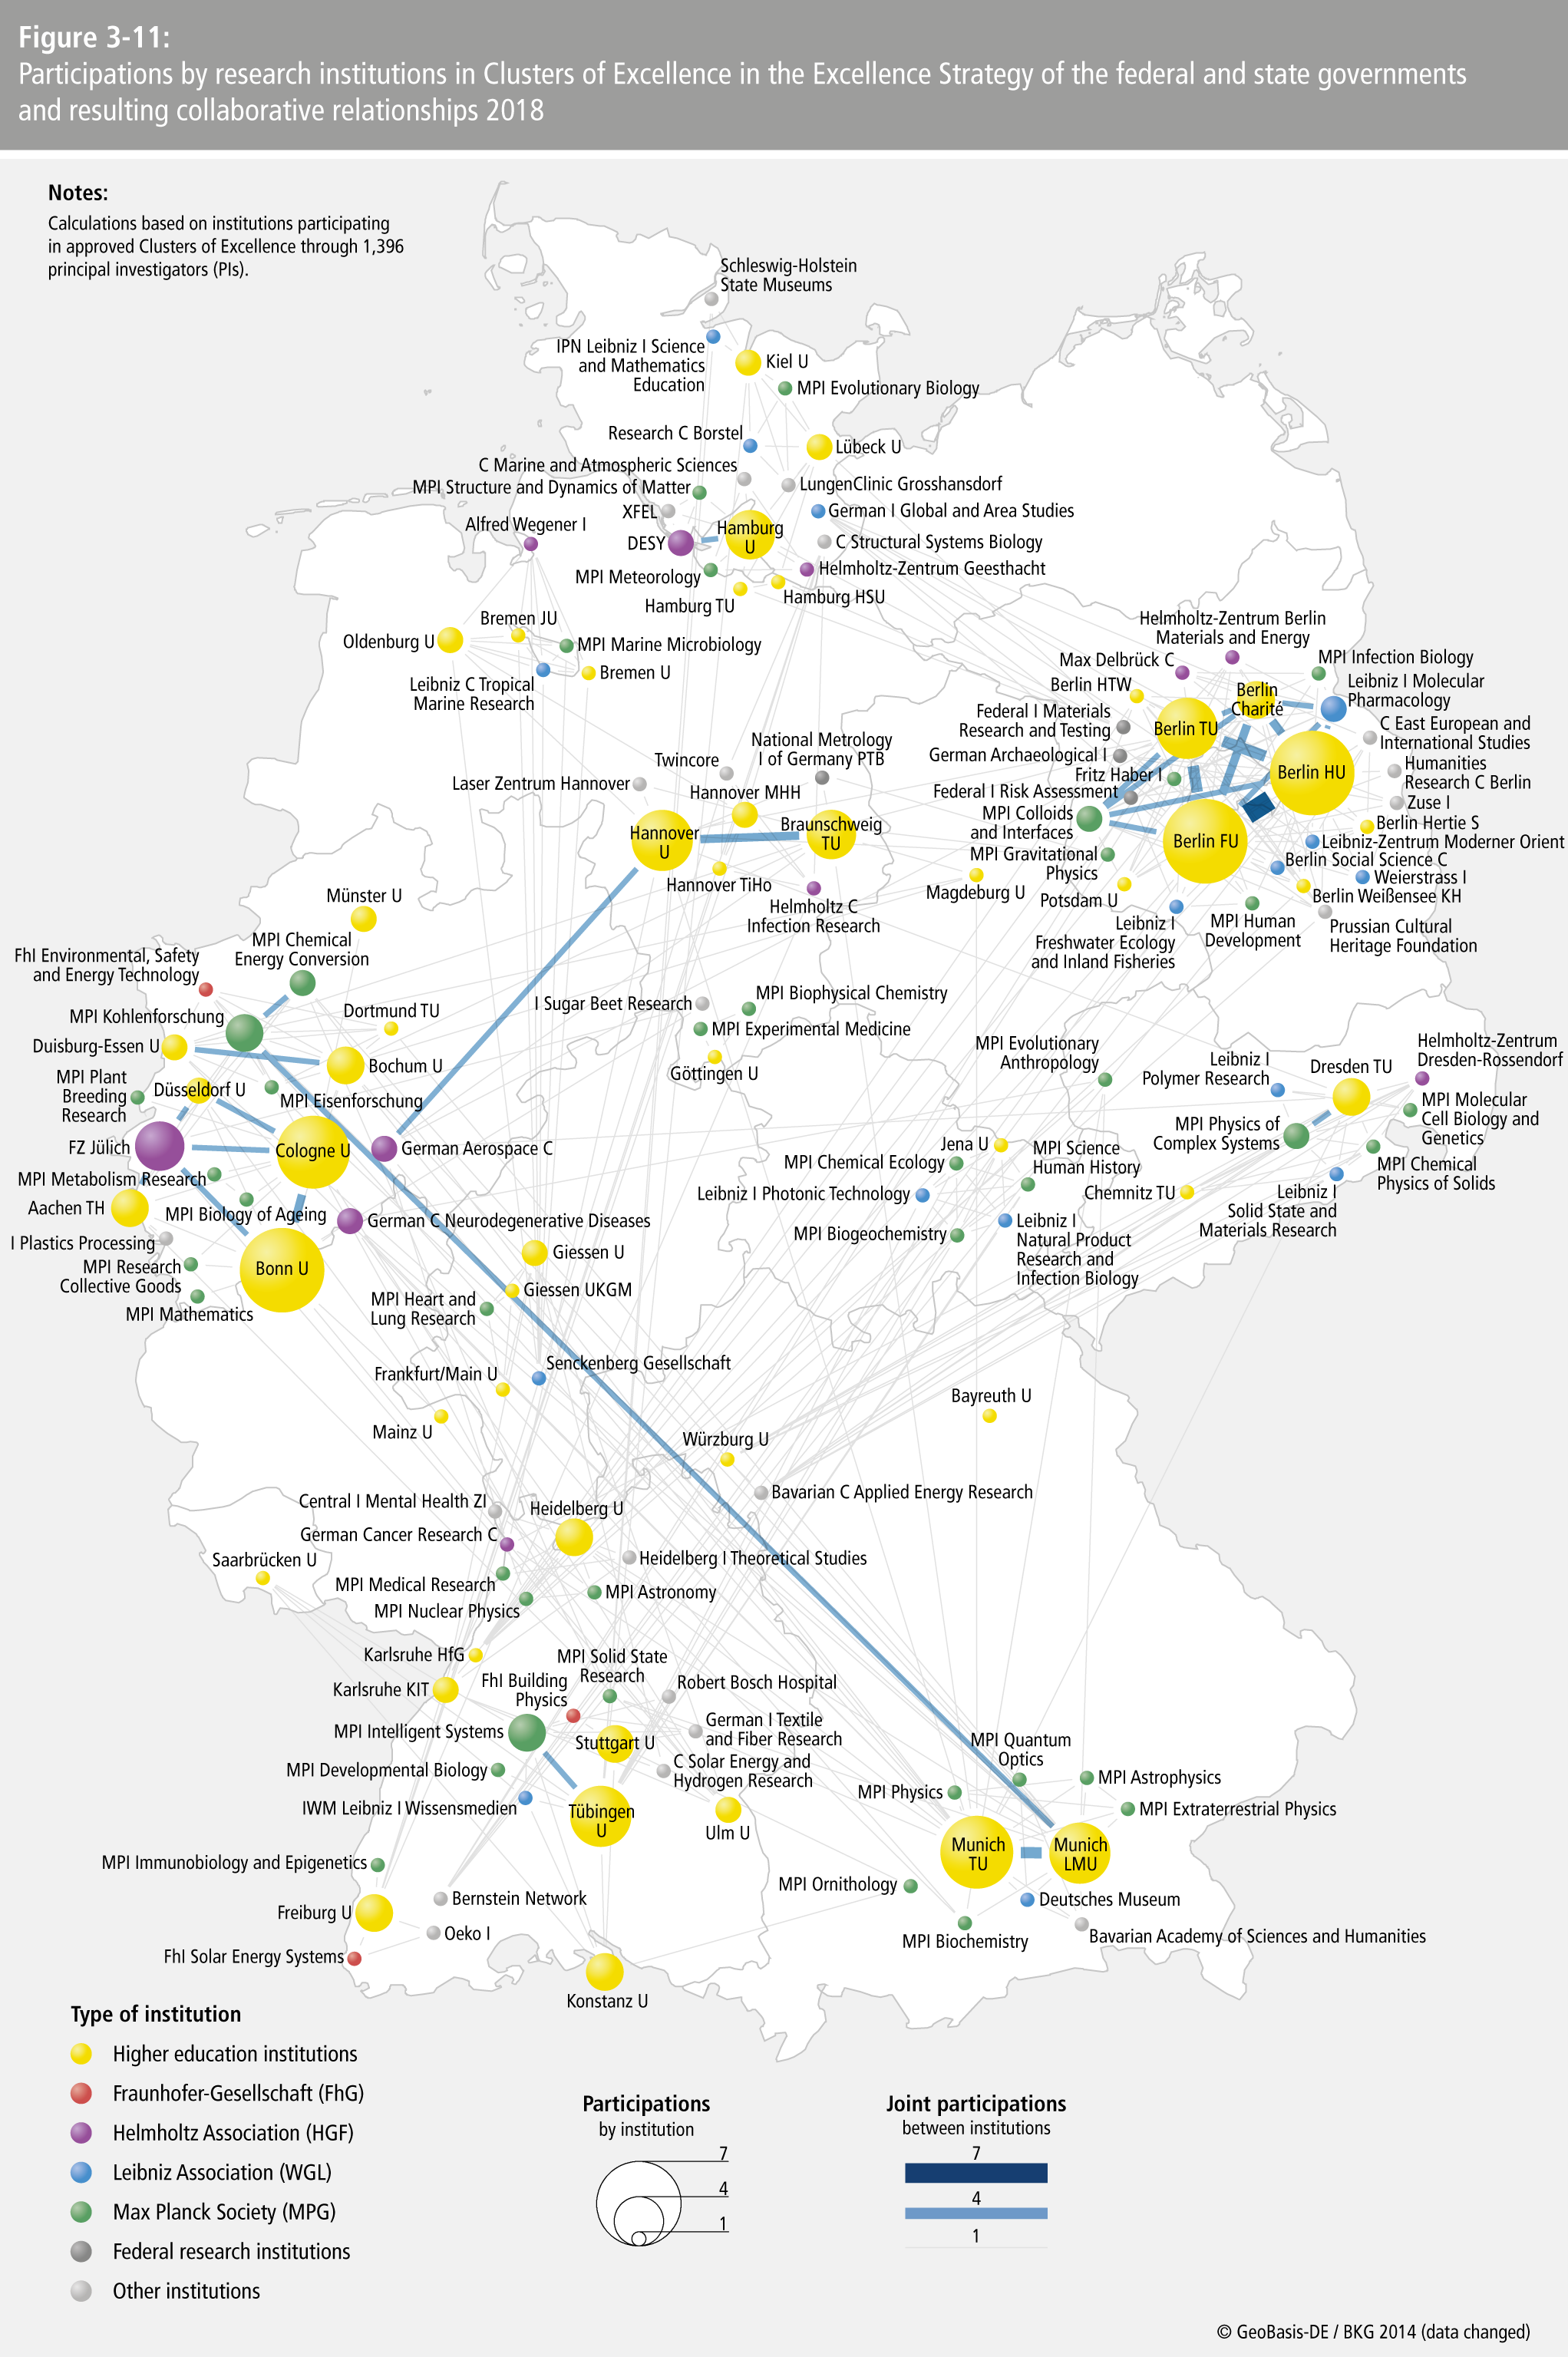
- Figure 3-11: Participations by research institutions in Clusters of Excellence in the Excellence Strategy of the federal and state governments and resulting collaborative relationships 201
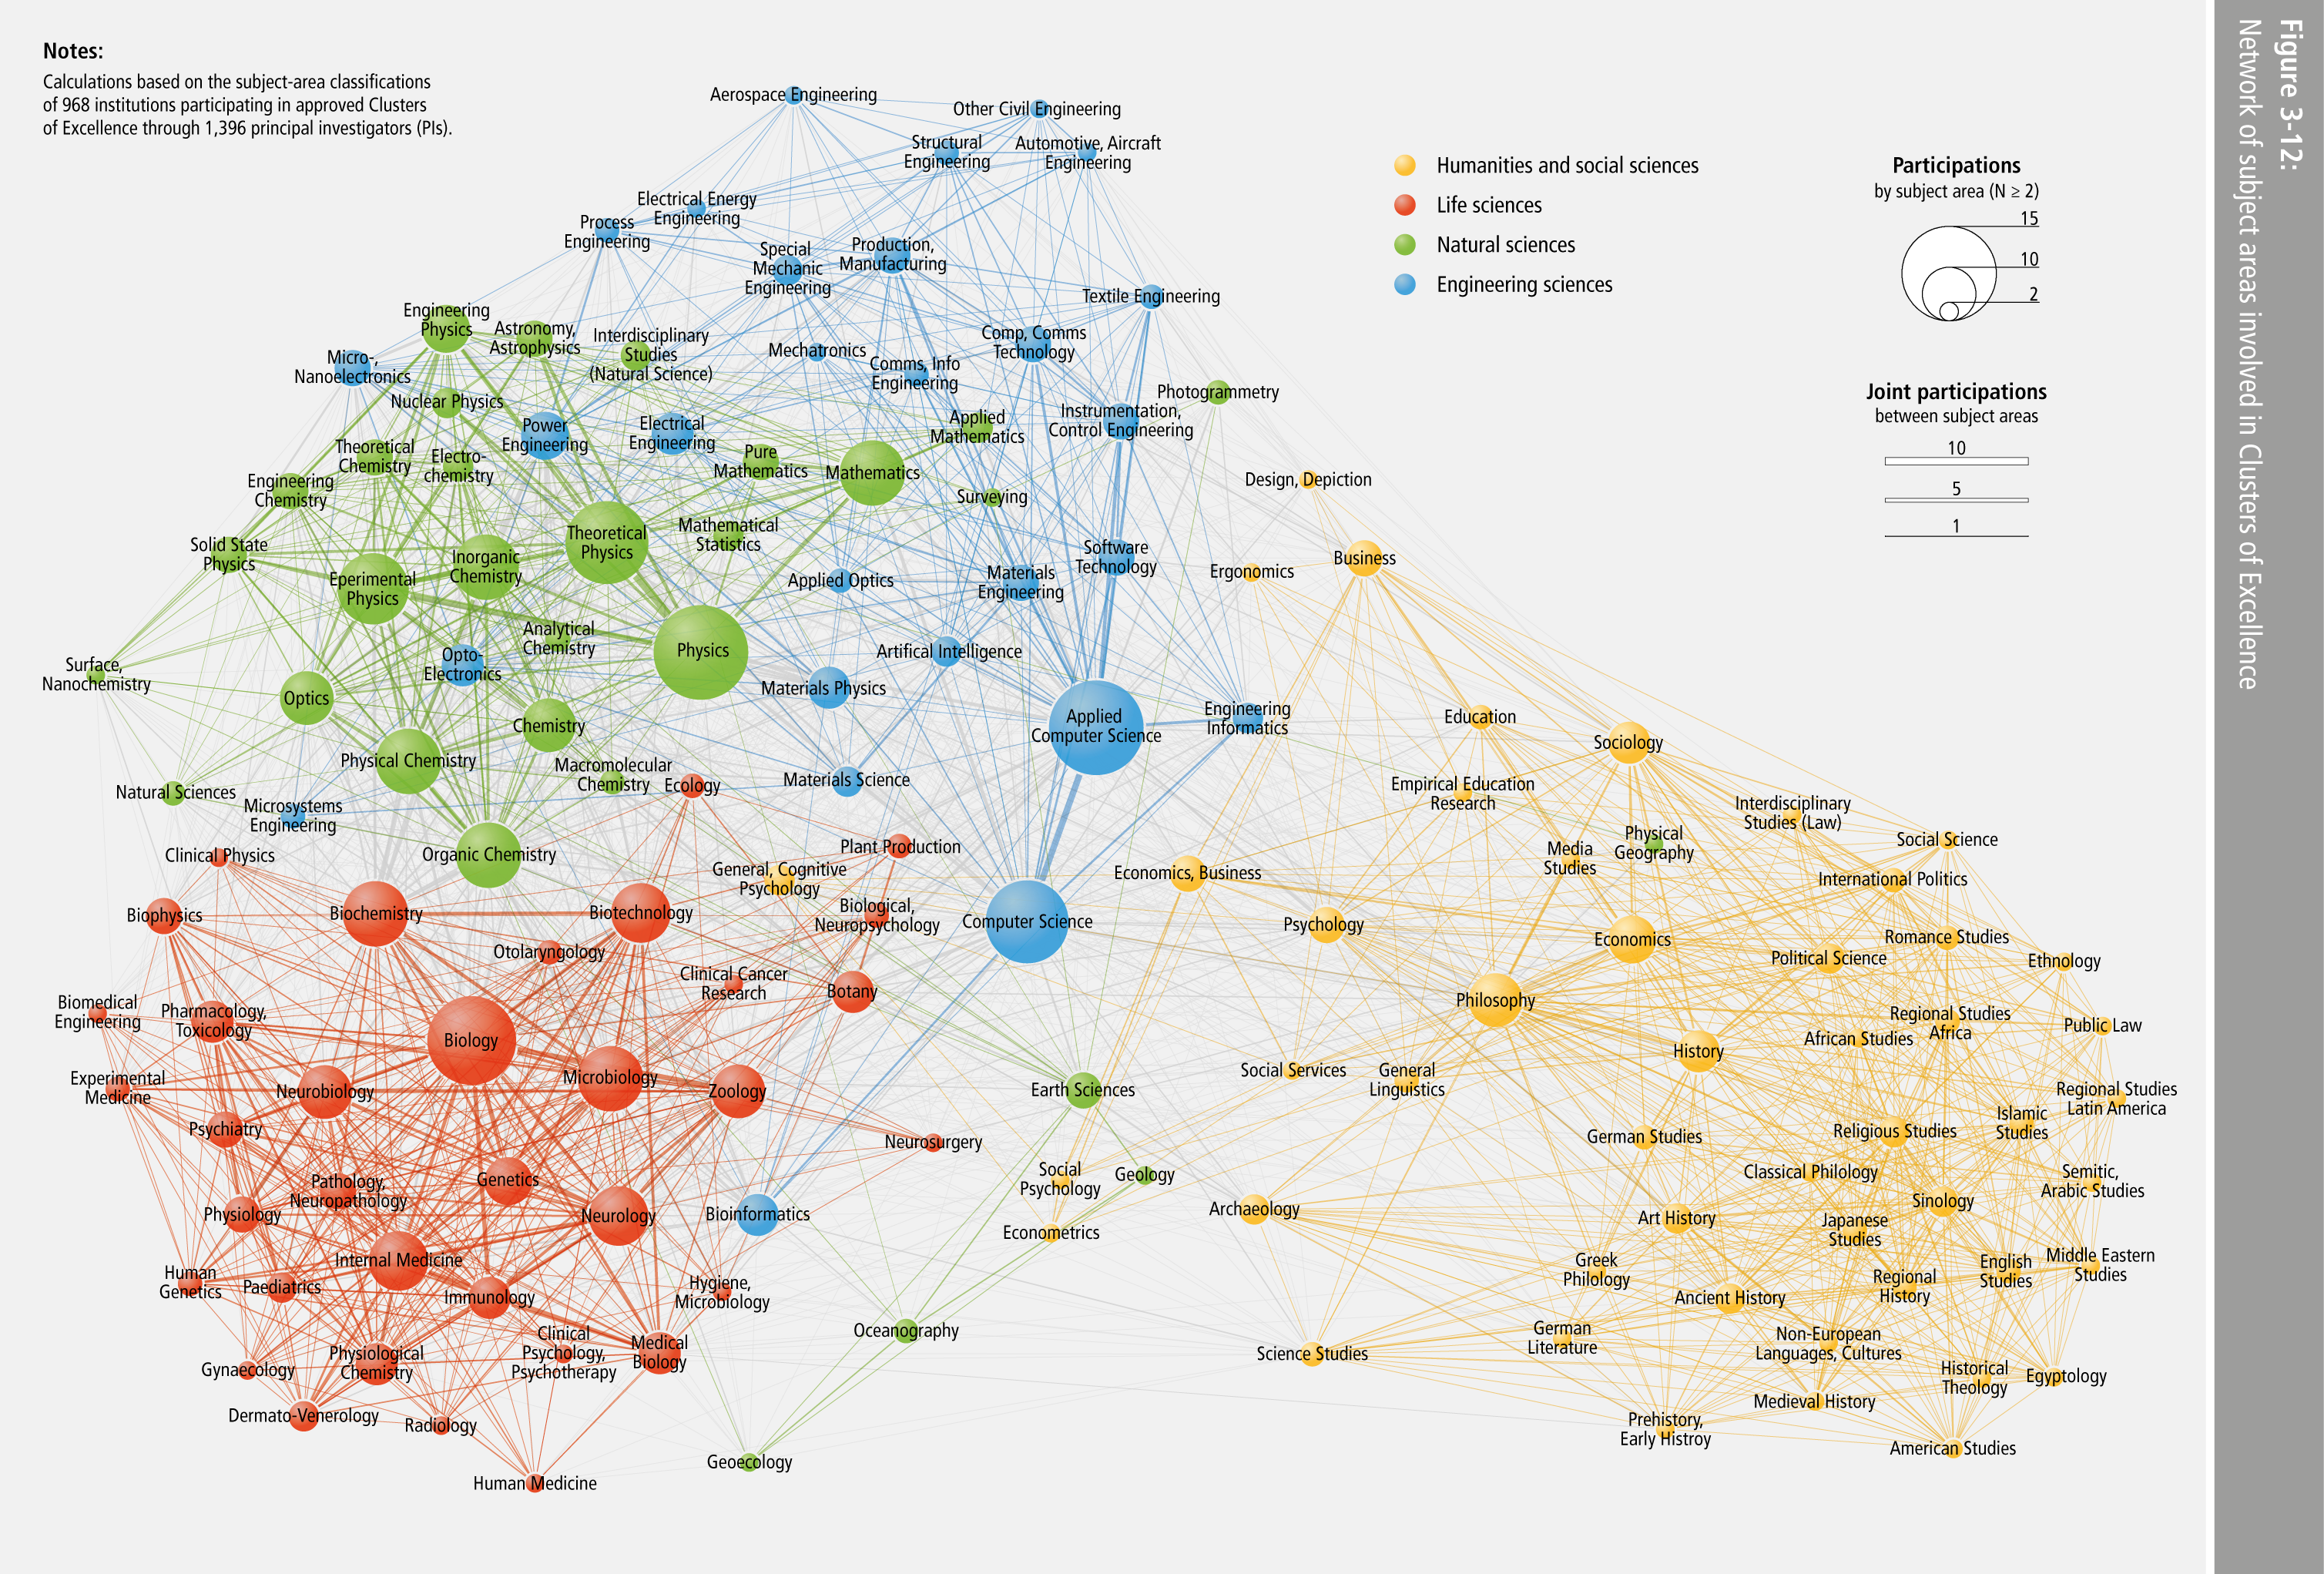
- Figure 3-12: Network of subject areas involved in Clusters of Excellenc
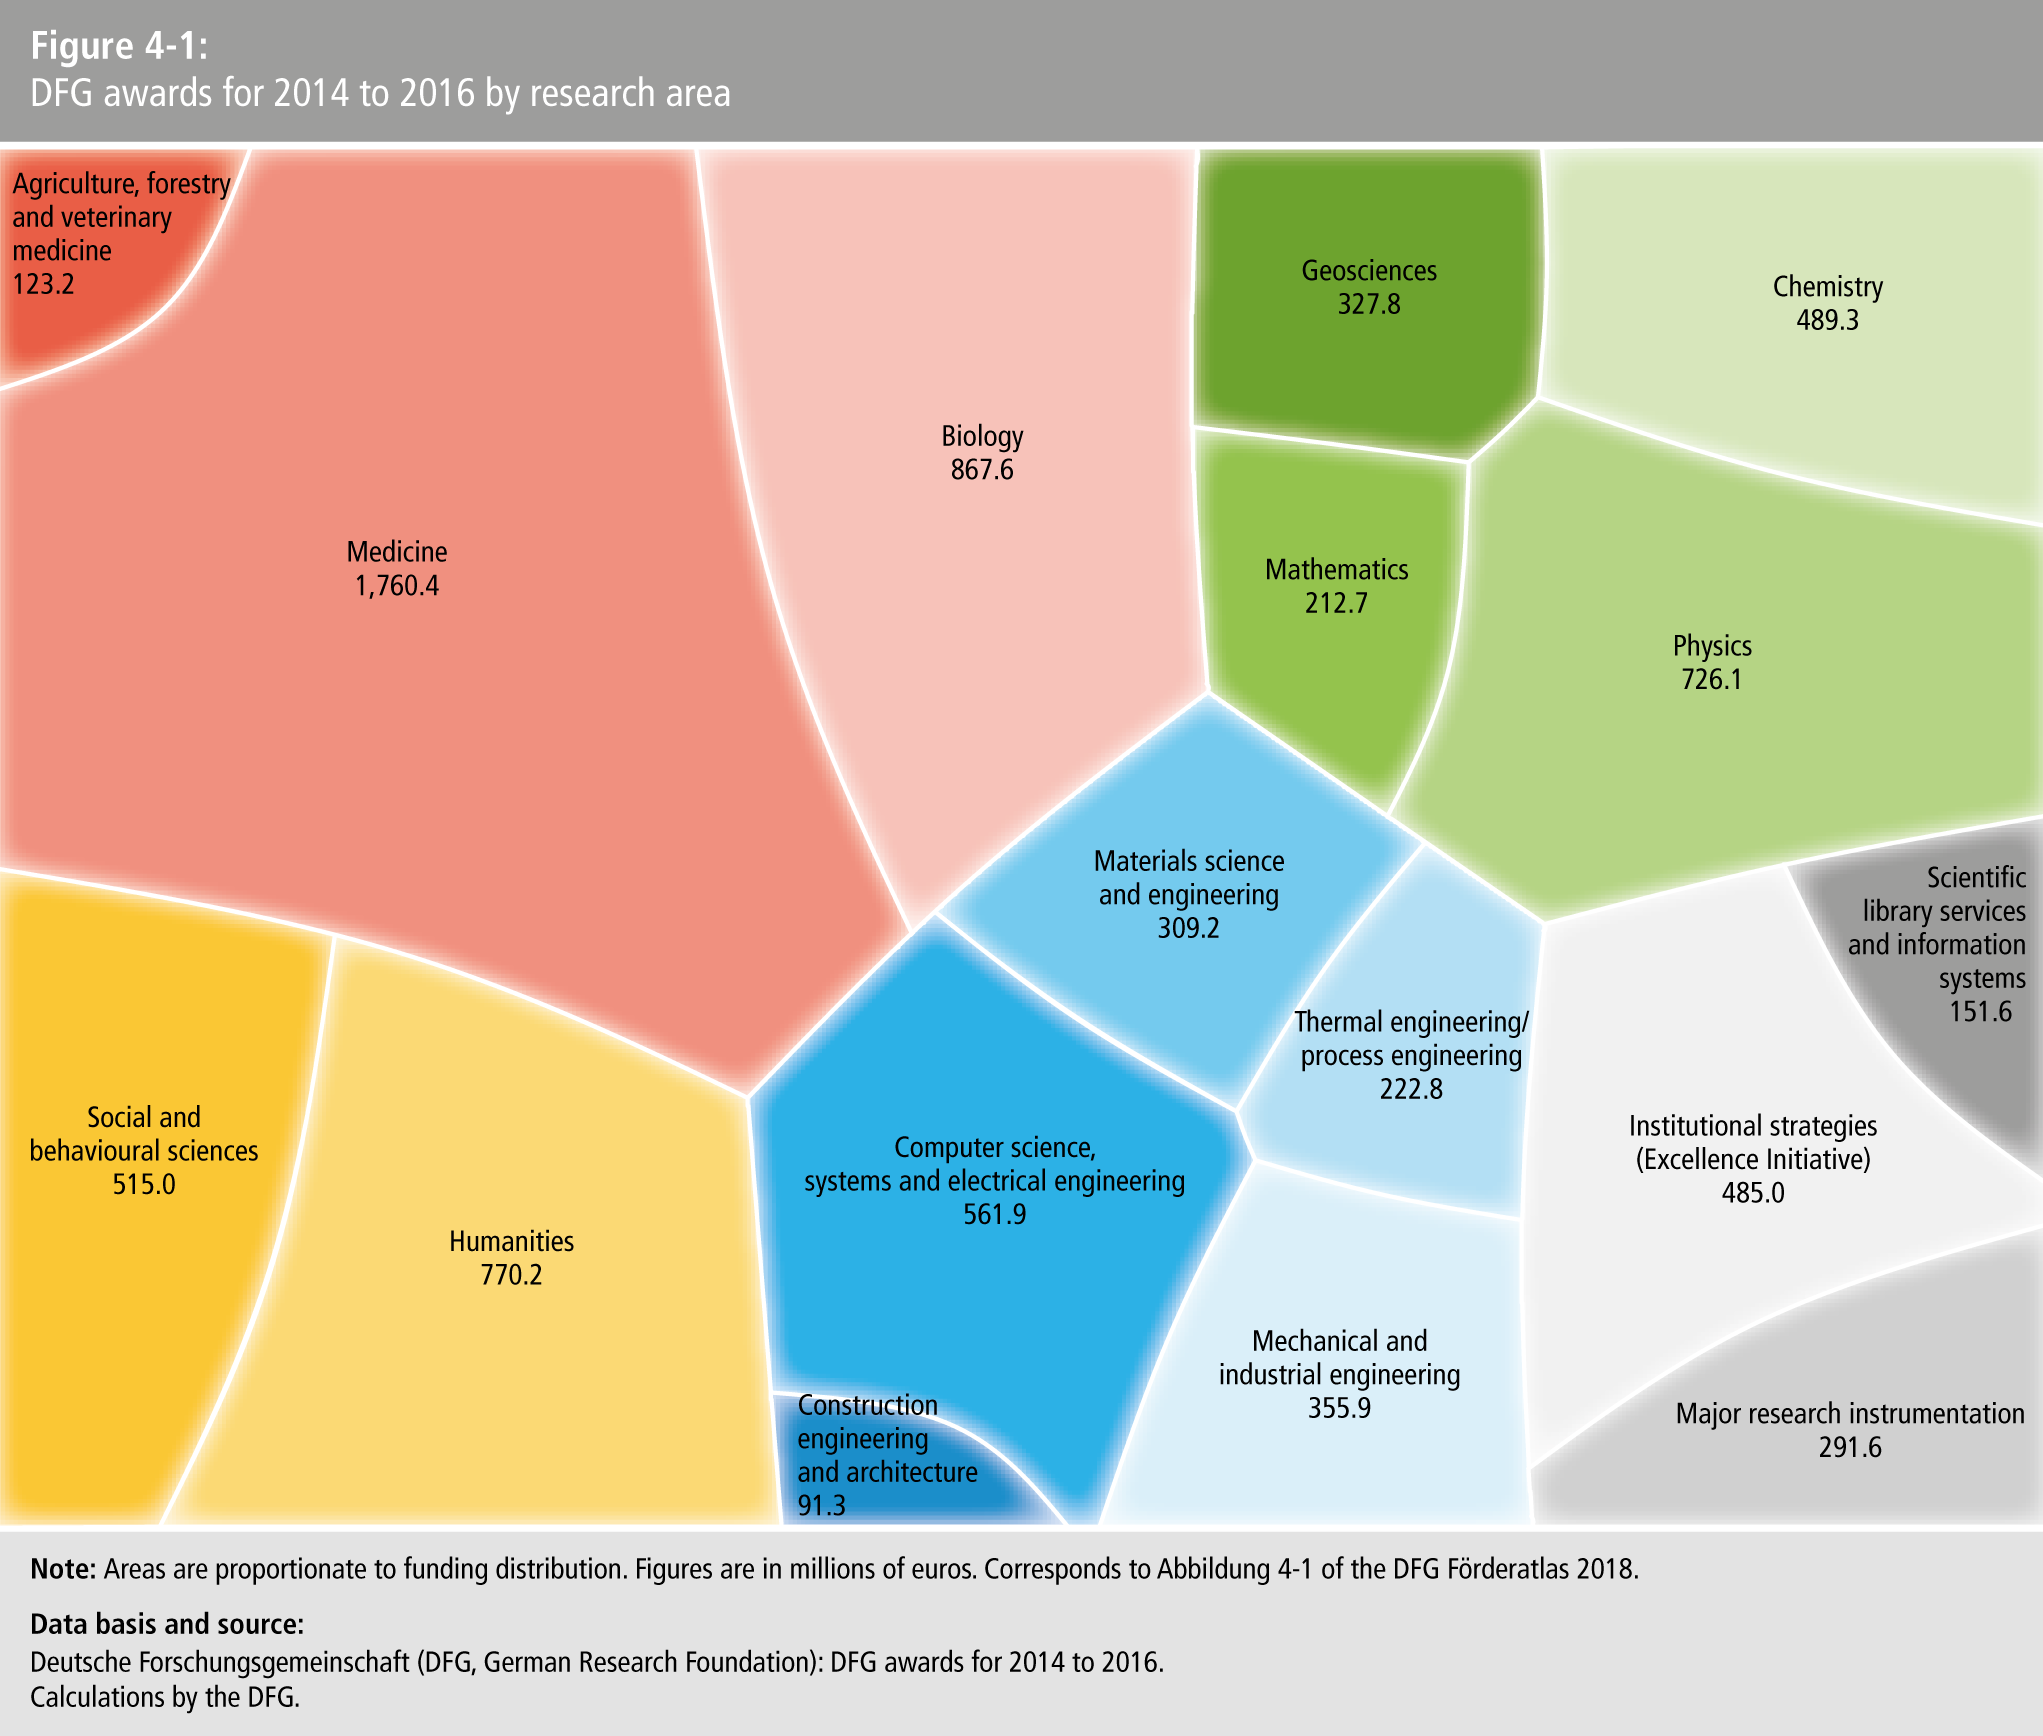
- Figure 4-1: DFG awards for 2014 to 2016 by research are
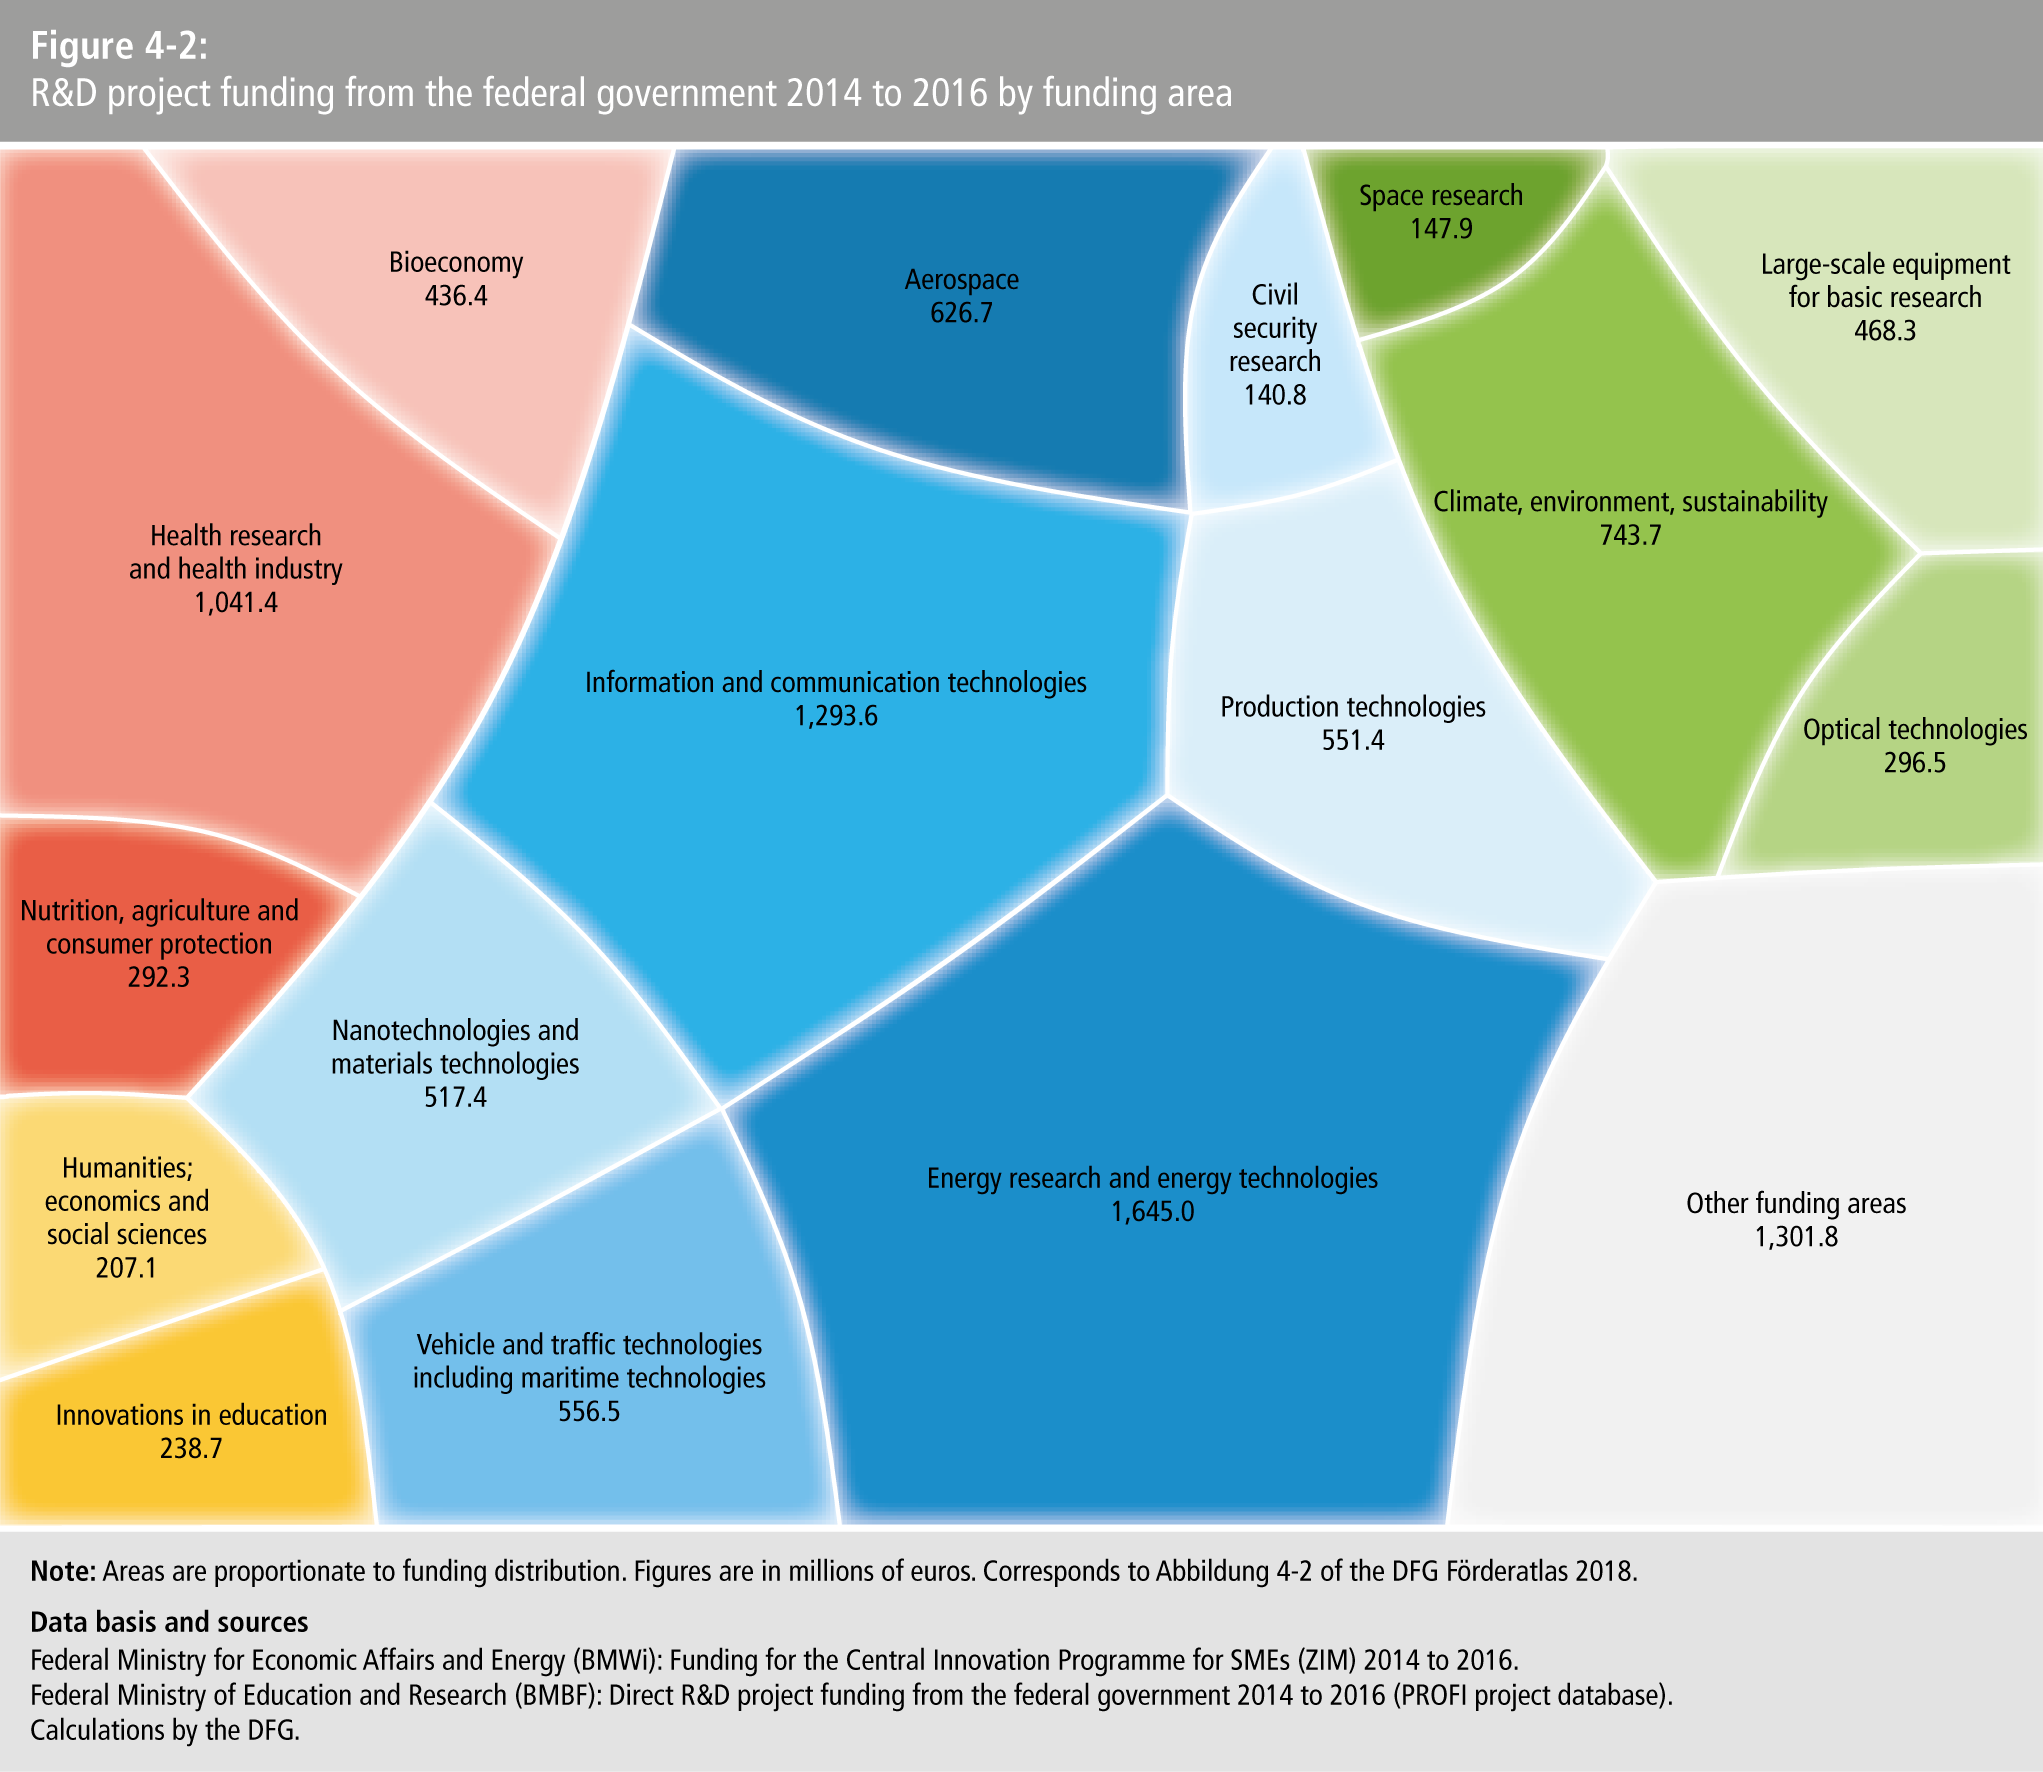
- Figure 4-2: R&D project funding from the federal government 2014 to 2016 by funding are
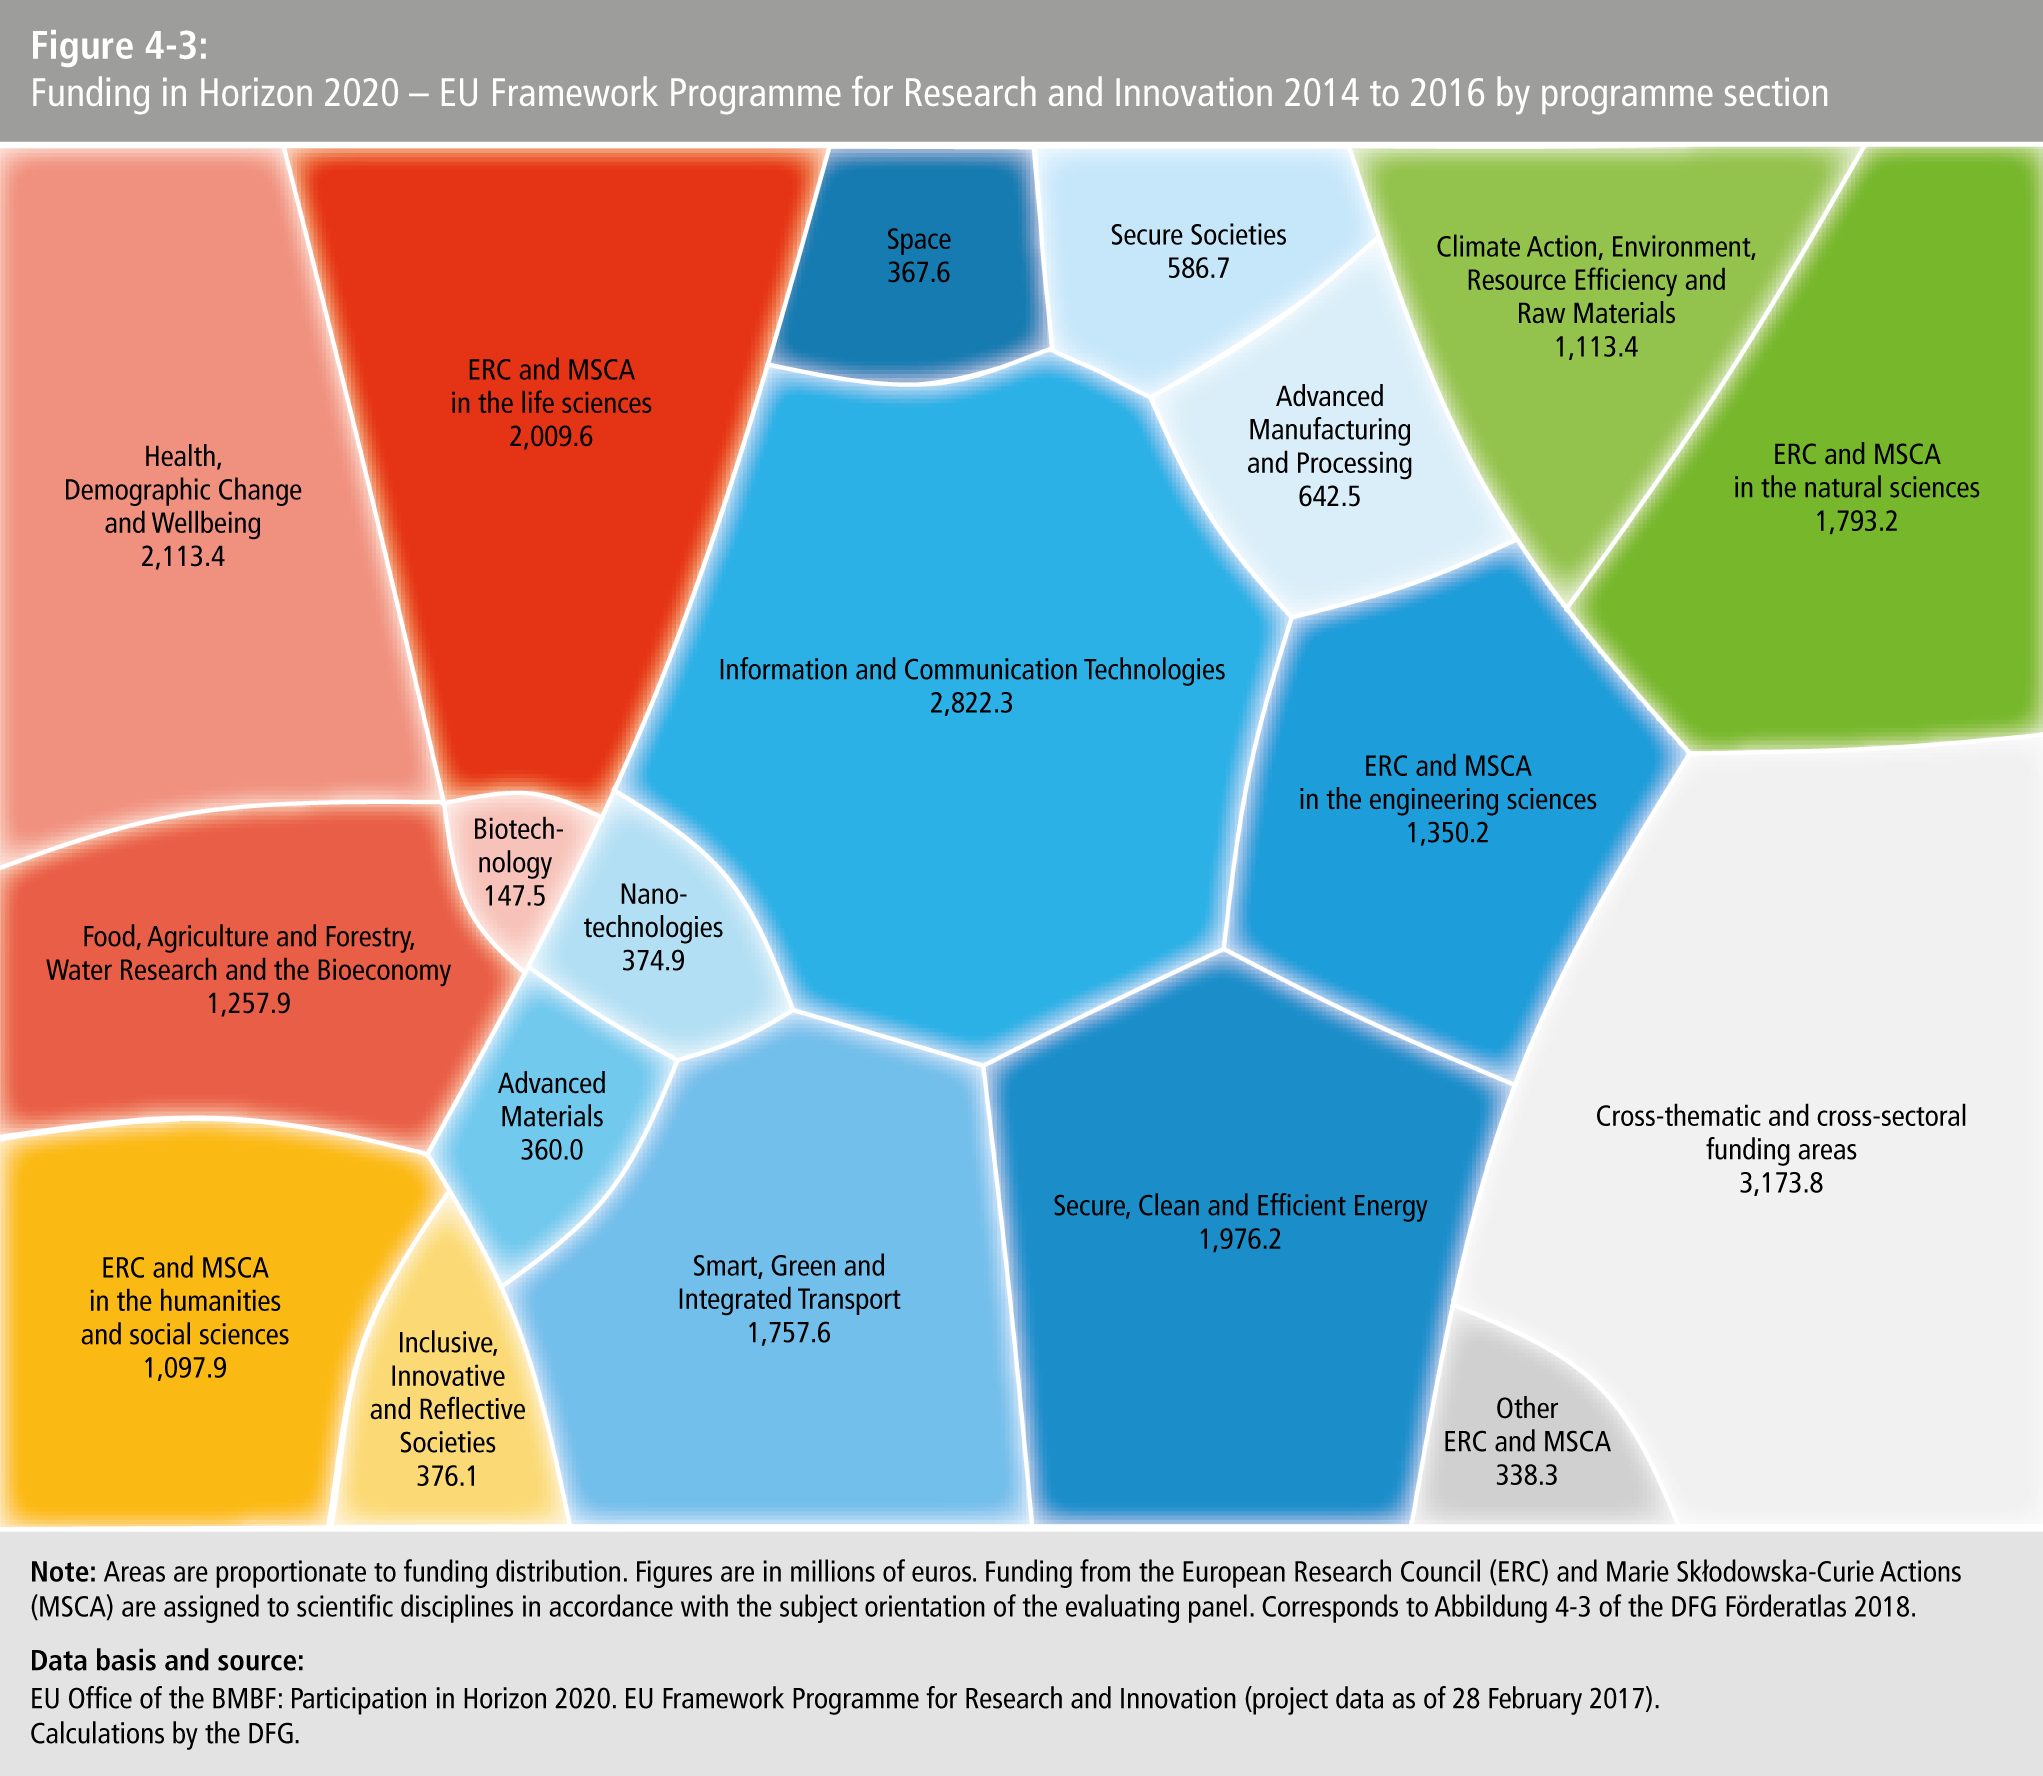
- Figure 4-3: Funding in Horizon 2020 – EU Framework Programme for Research and Innovation 2014 to 2016 by programme sectio
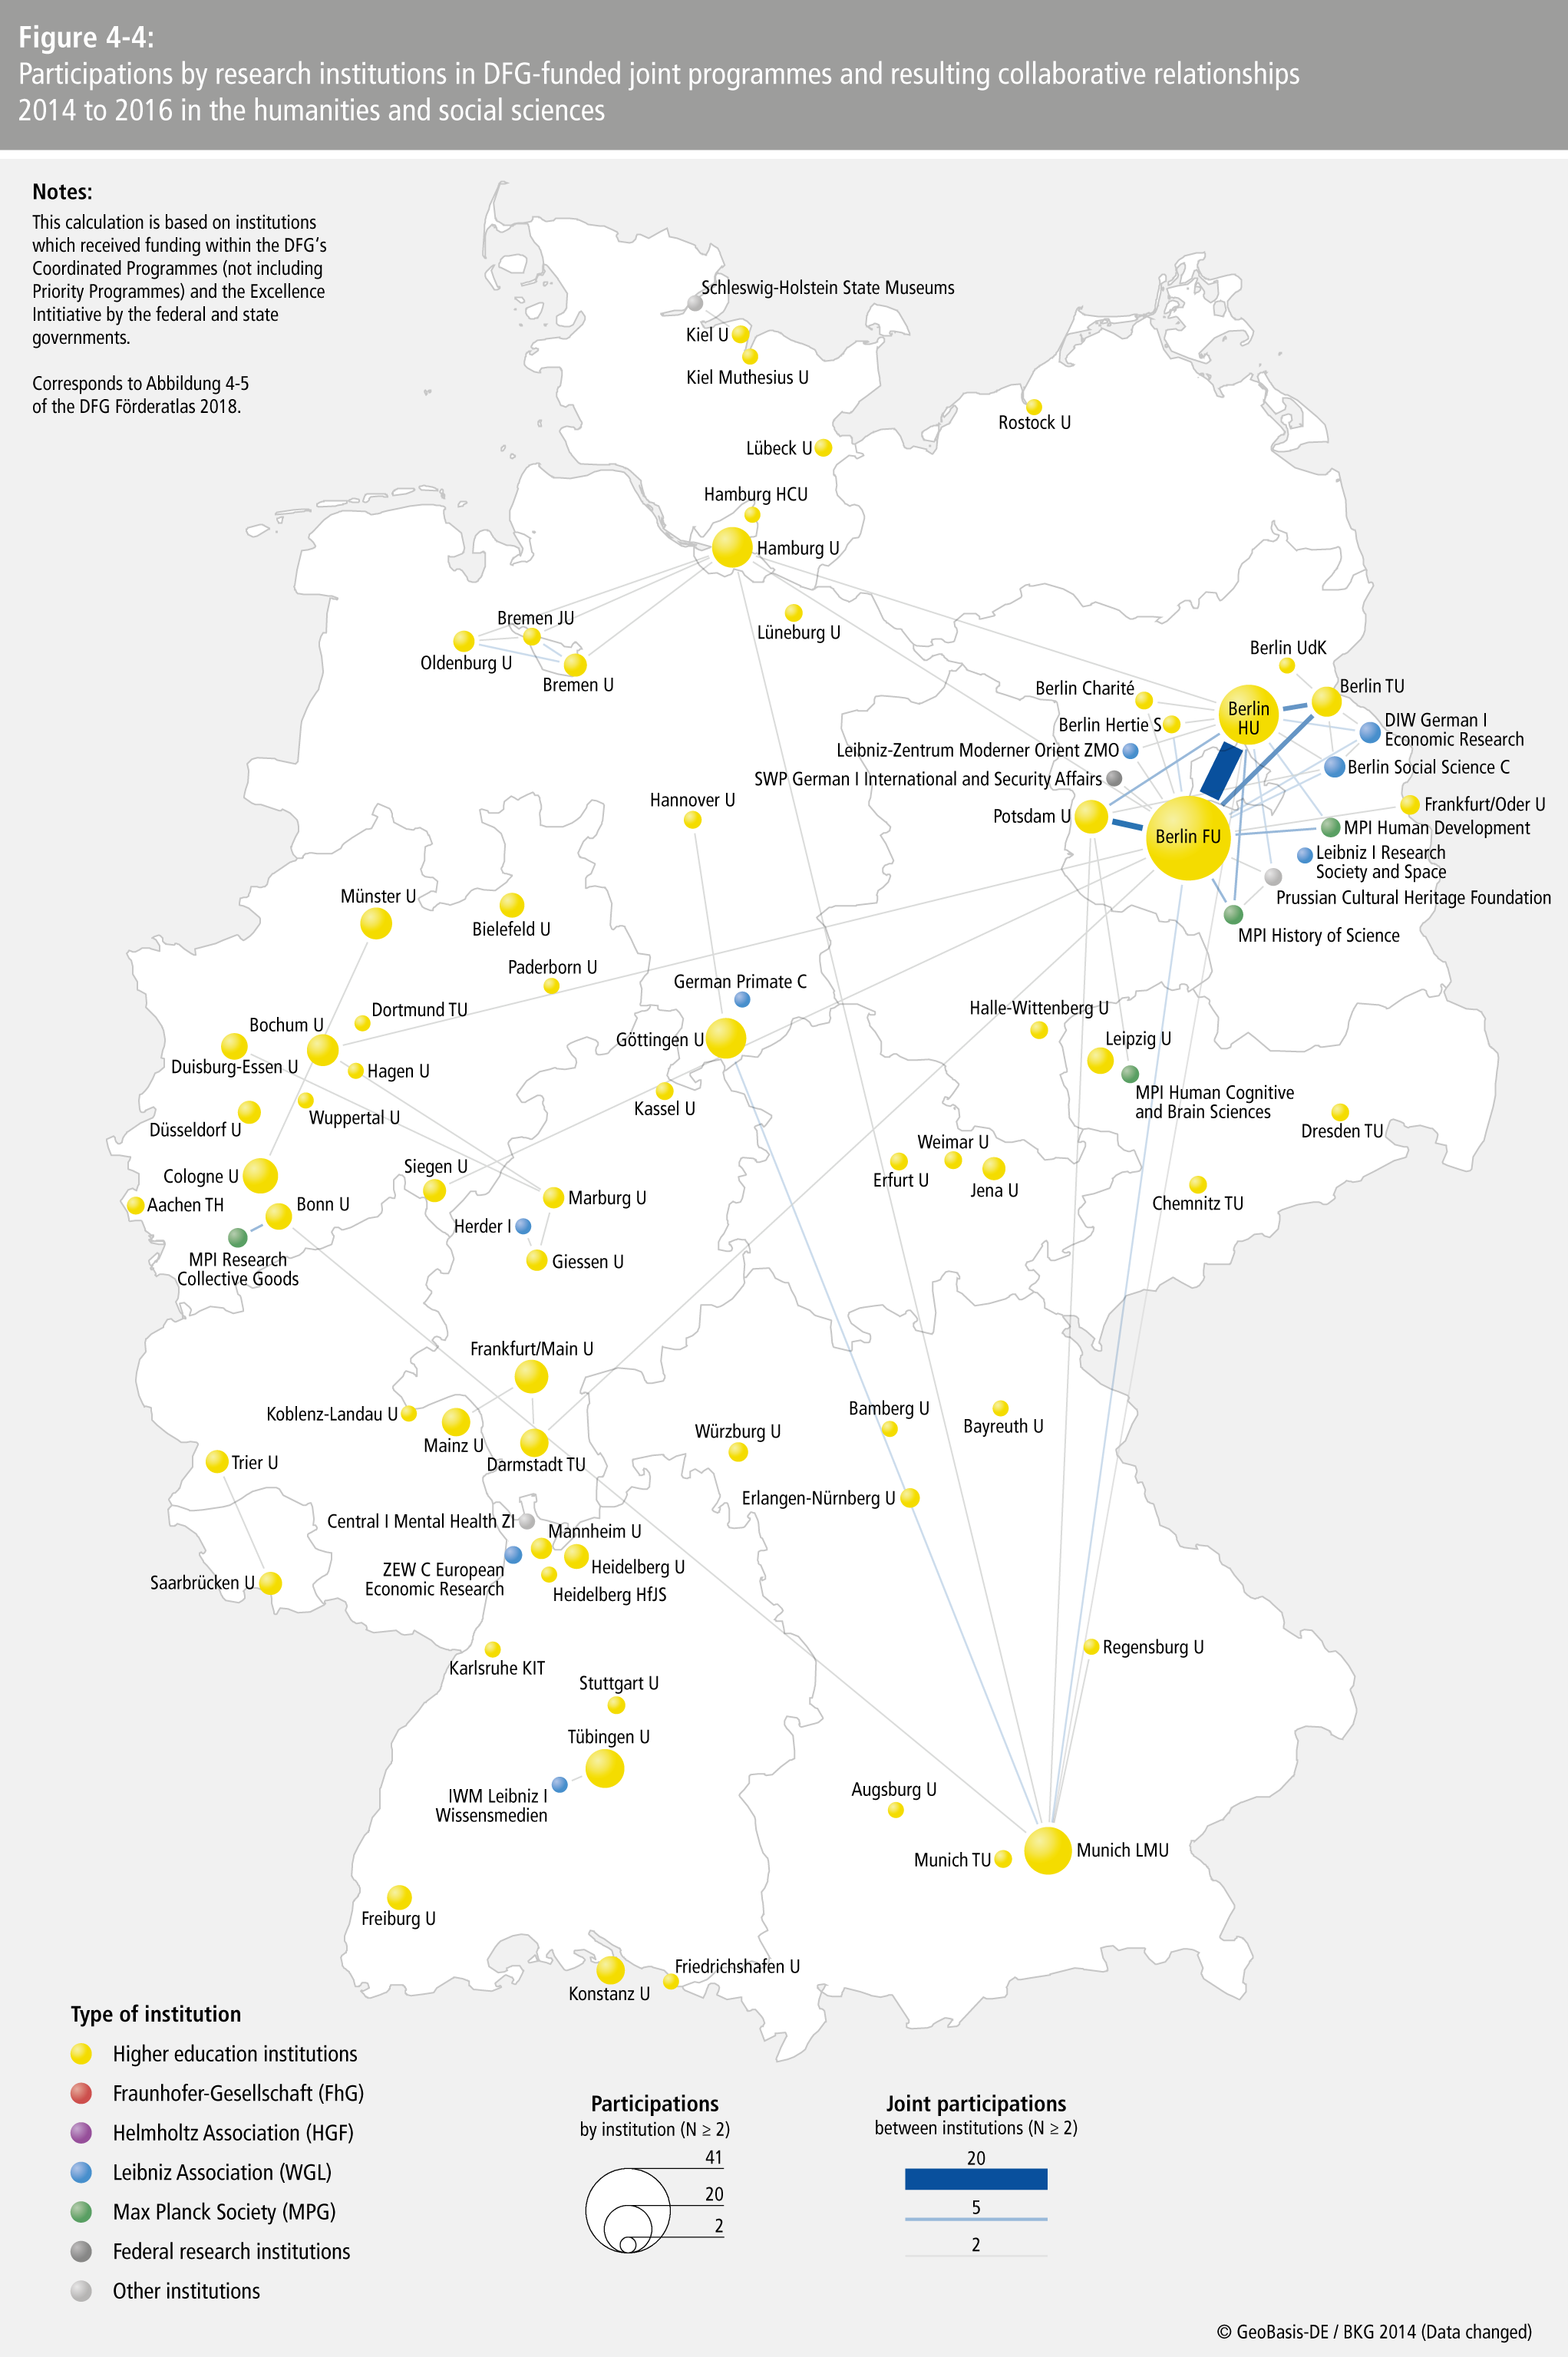
- Figure 4-4: Participations by research institutions in DFG-funded joint programmes and resulting collaborative relationships 2014 to 2016 in the humanities and social science
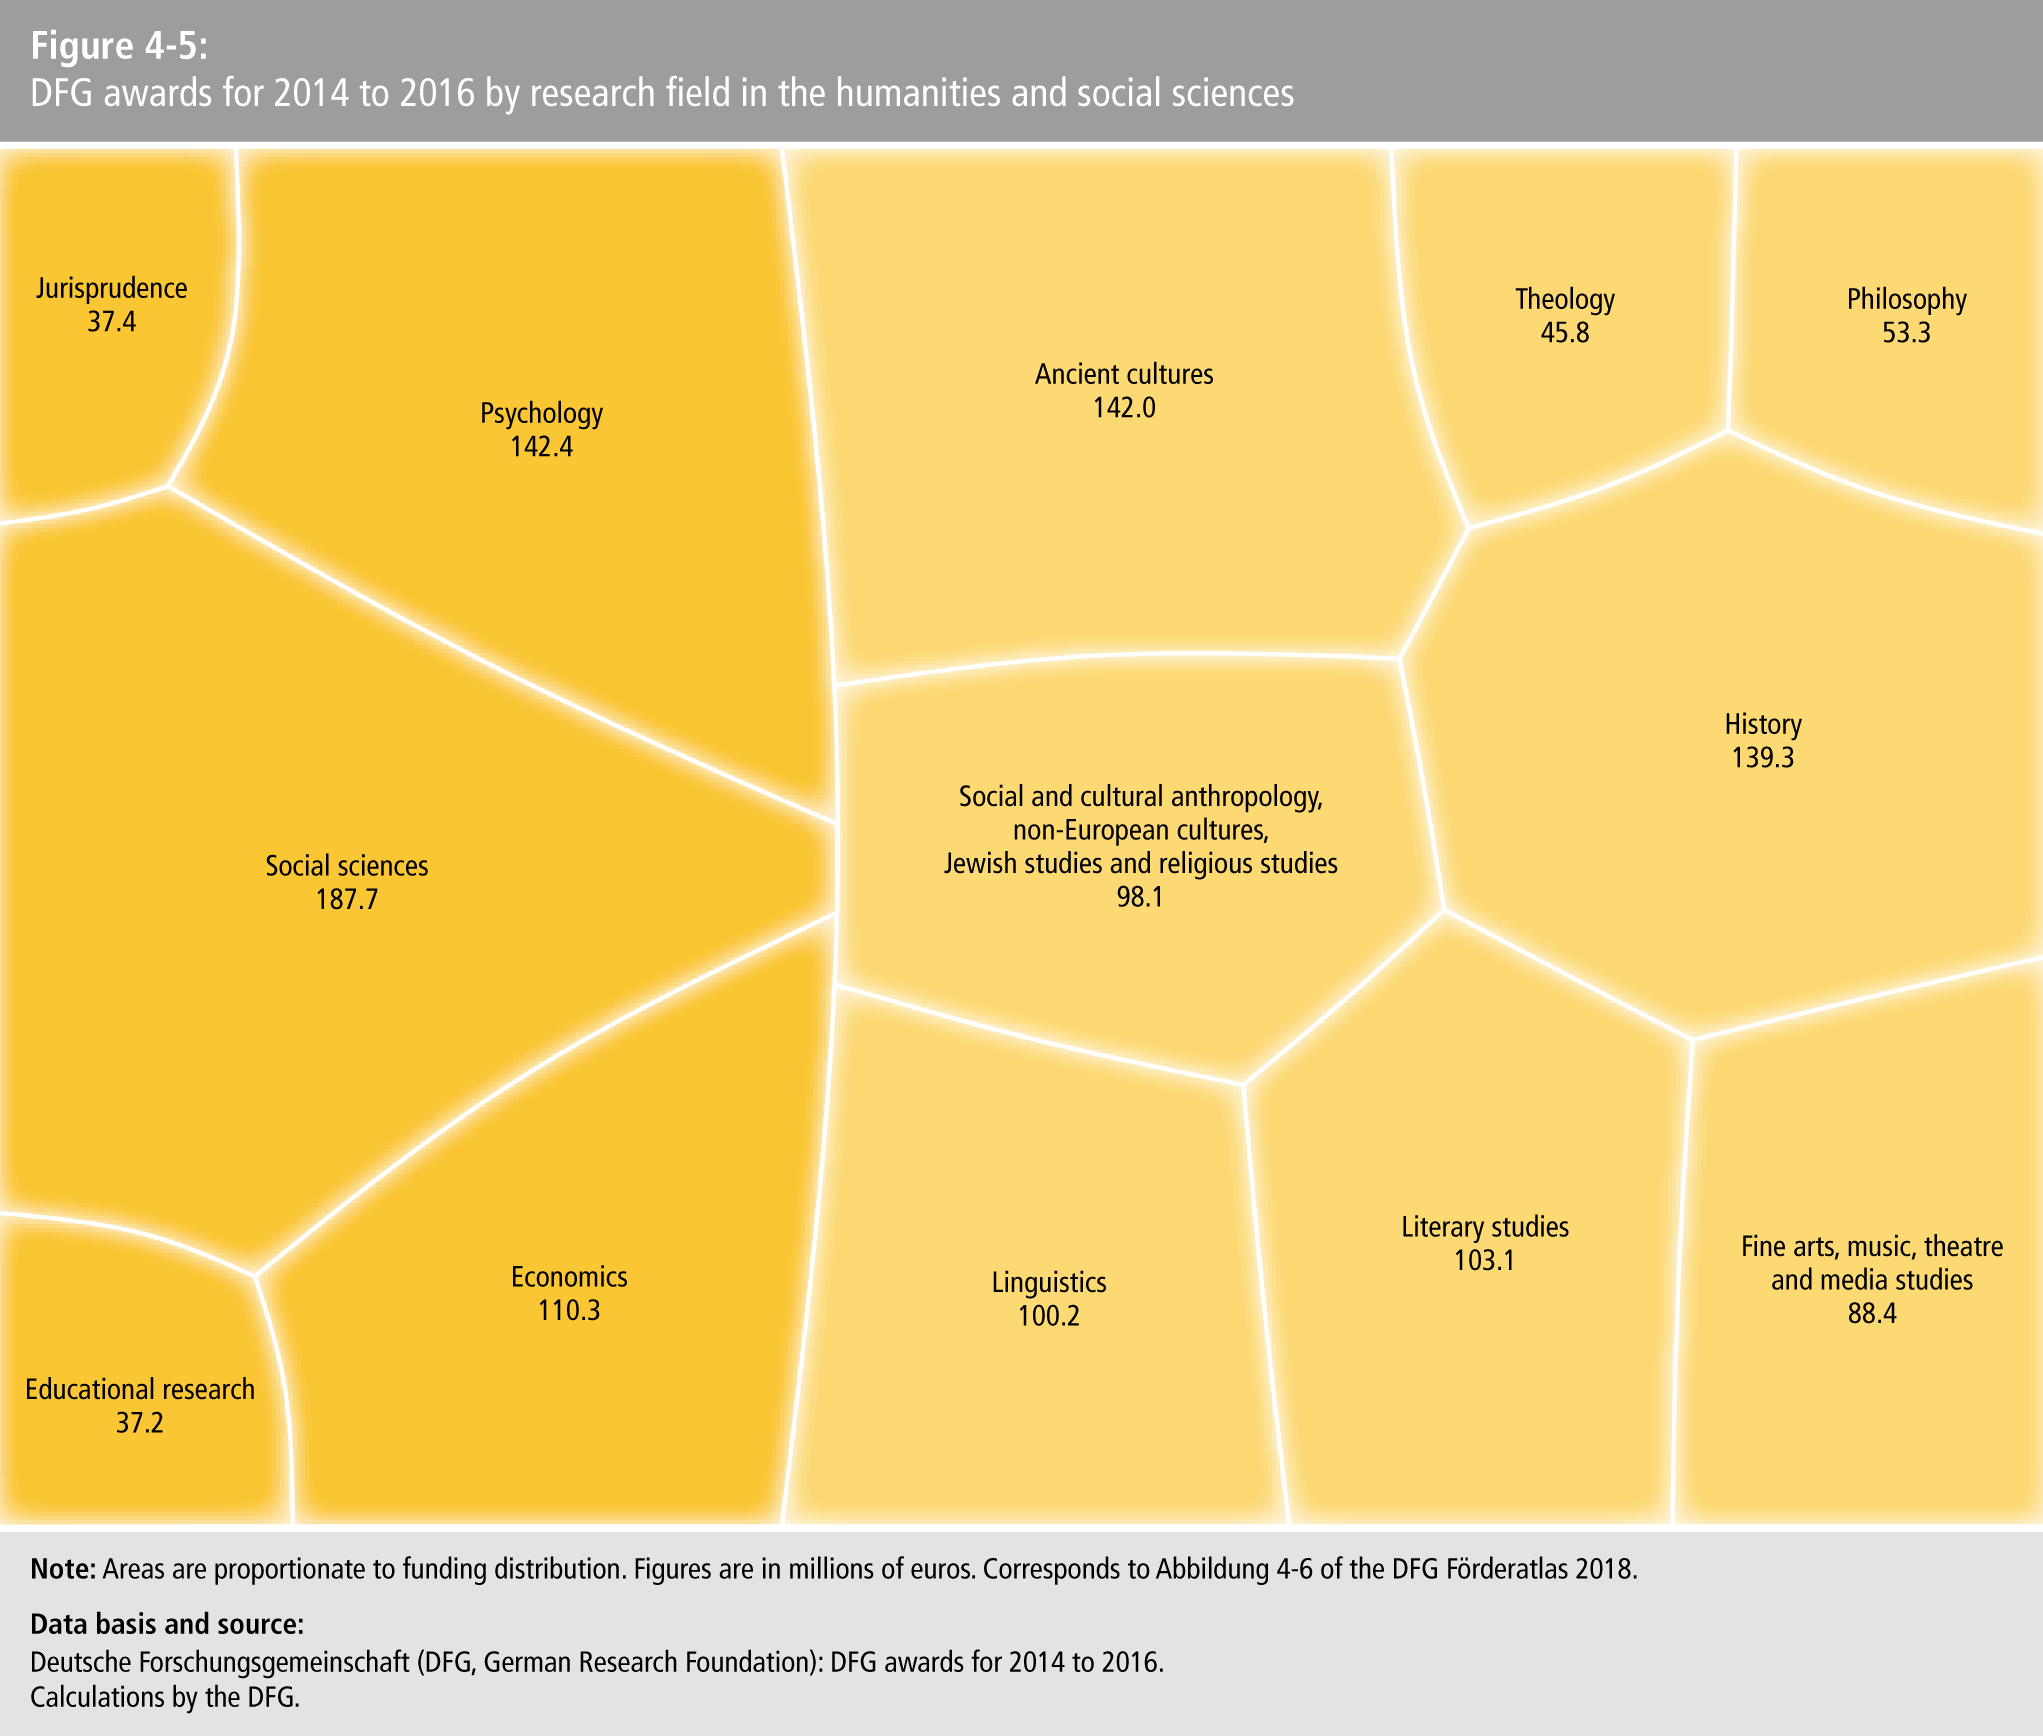
- Figure 4-5: DFG awards for 2014 to 2016 by research field in the humanities and social science
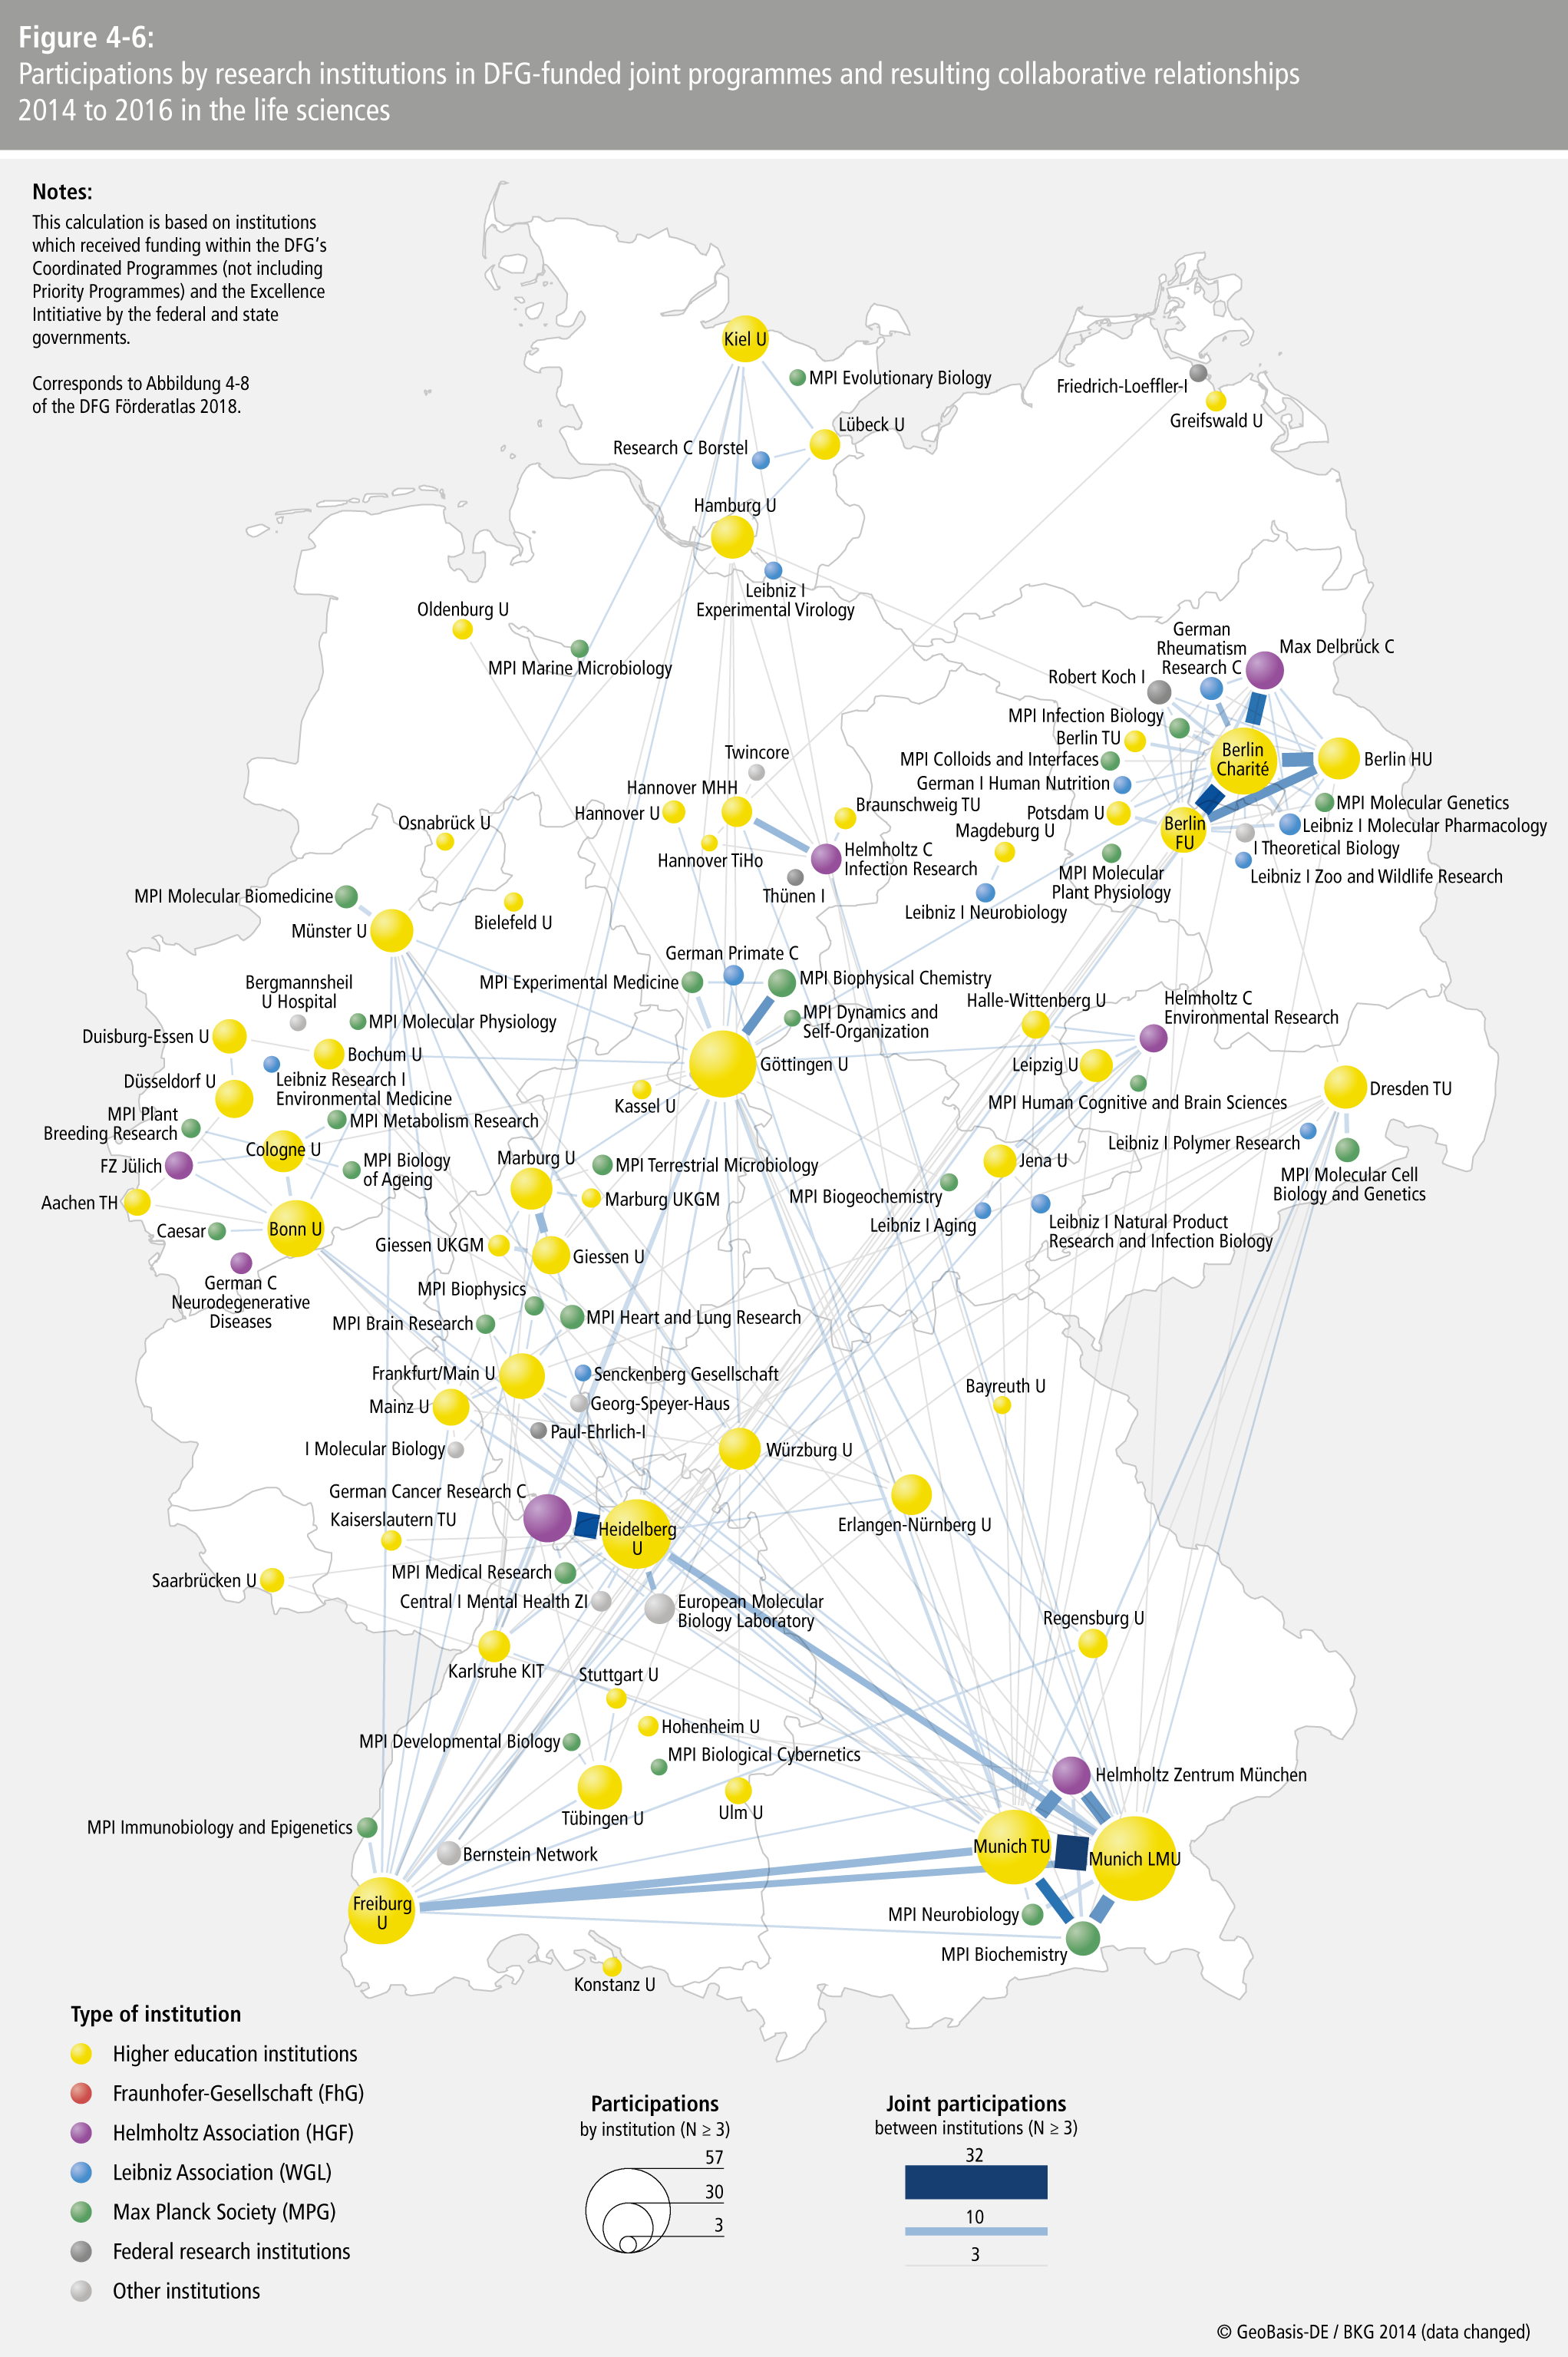
- Figure 4-6: Participations by research institutions in DFG-funded joint programmes and resulting collaborative relationships 2014 to 2016 in the life science
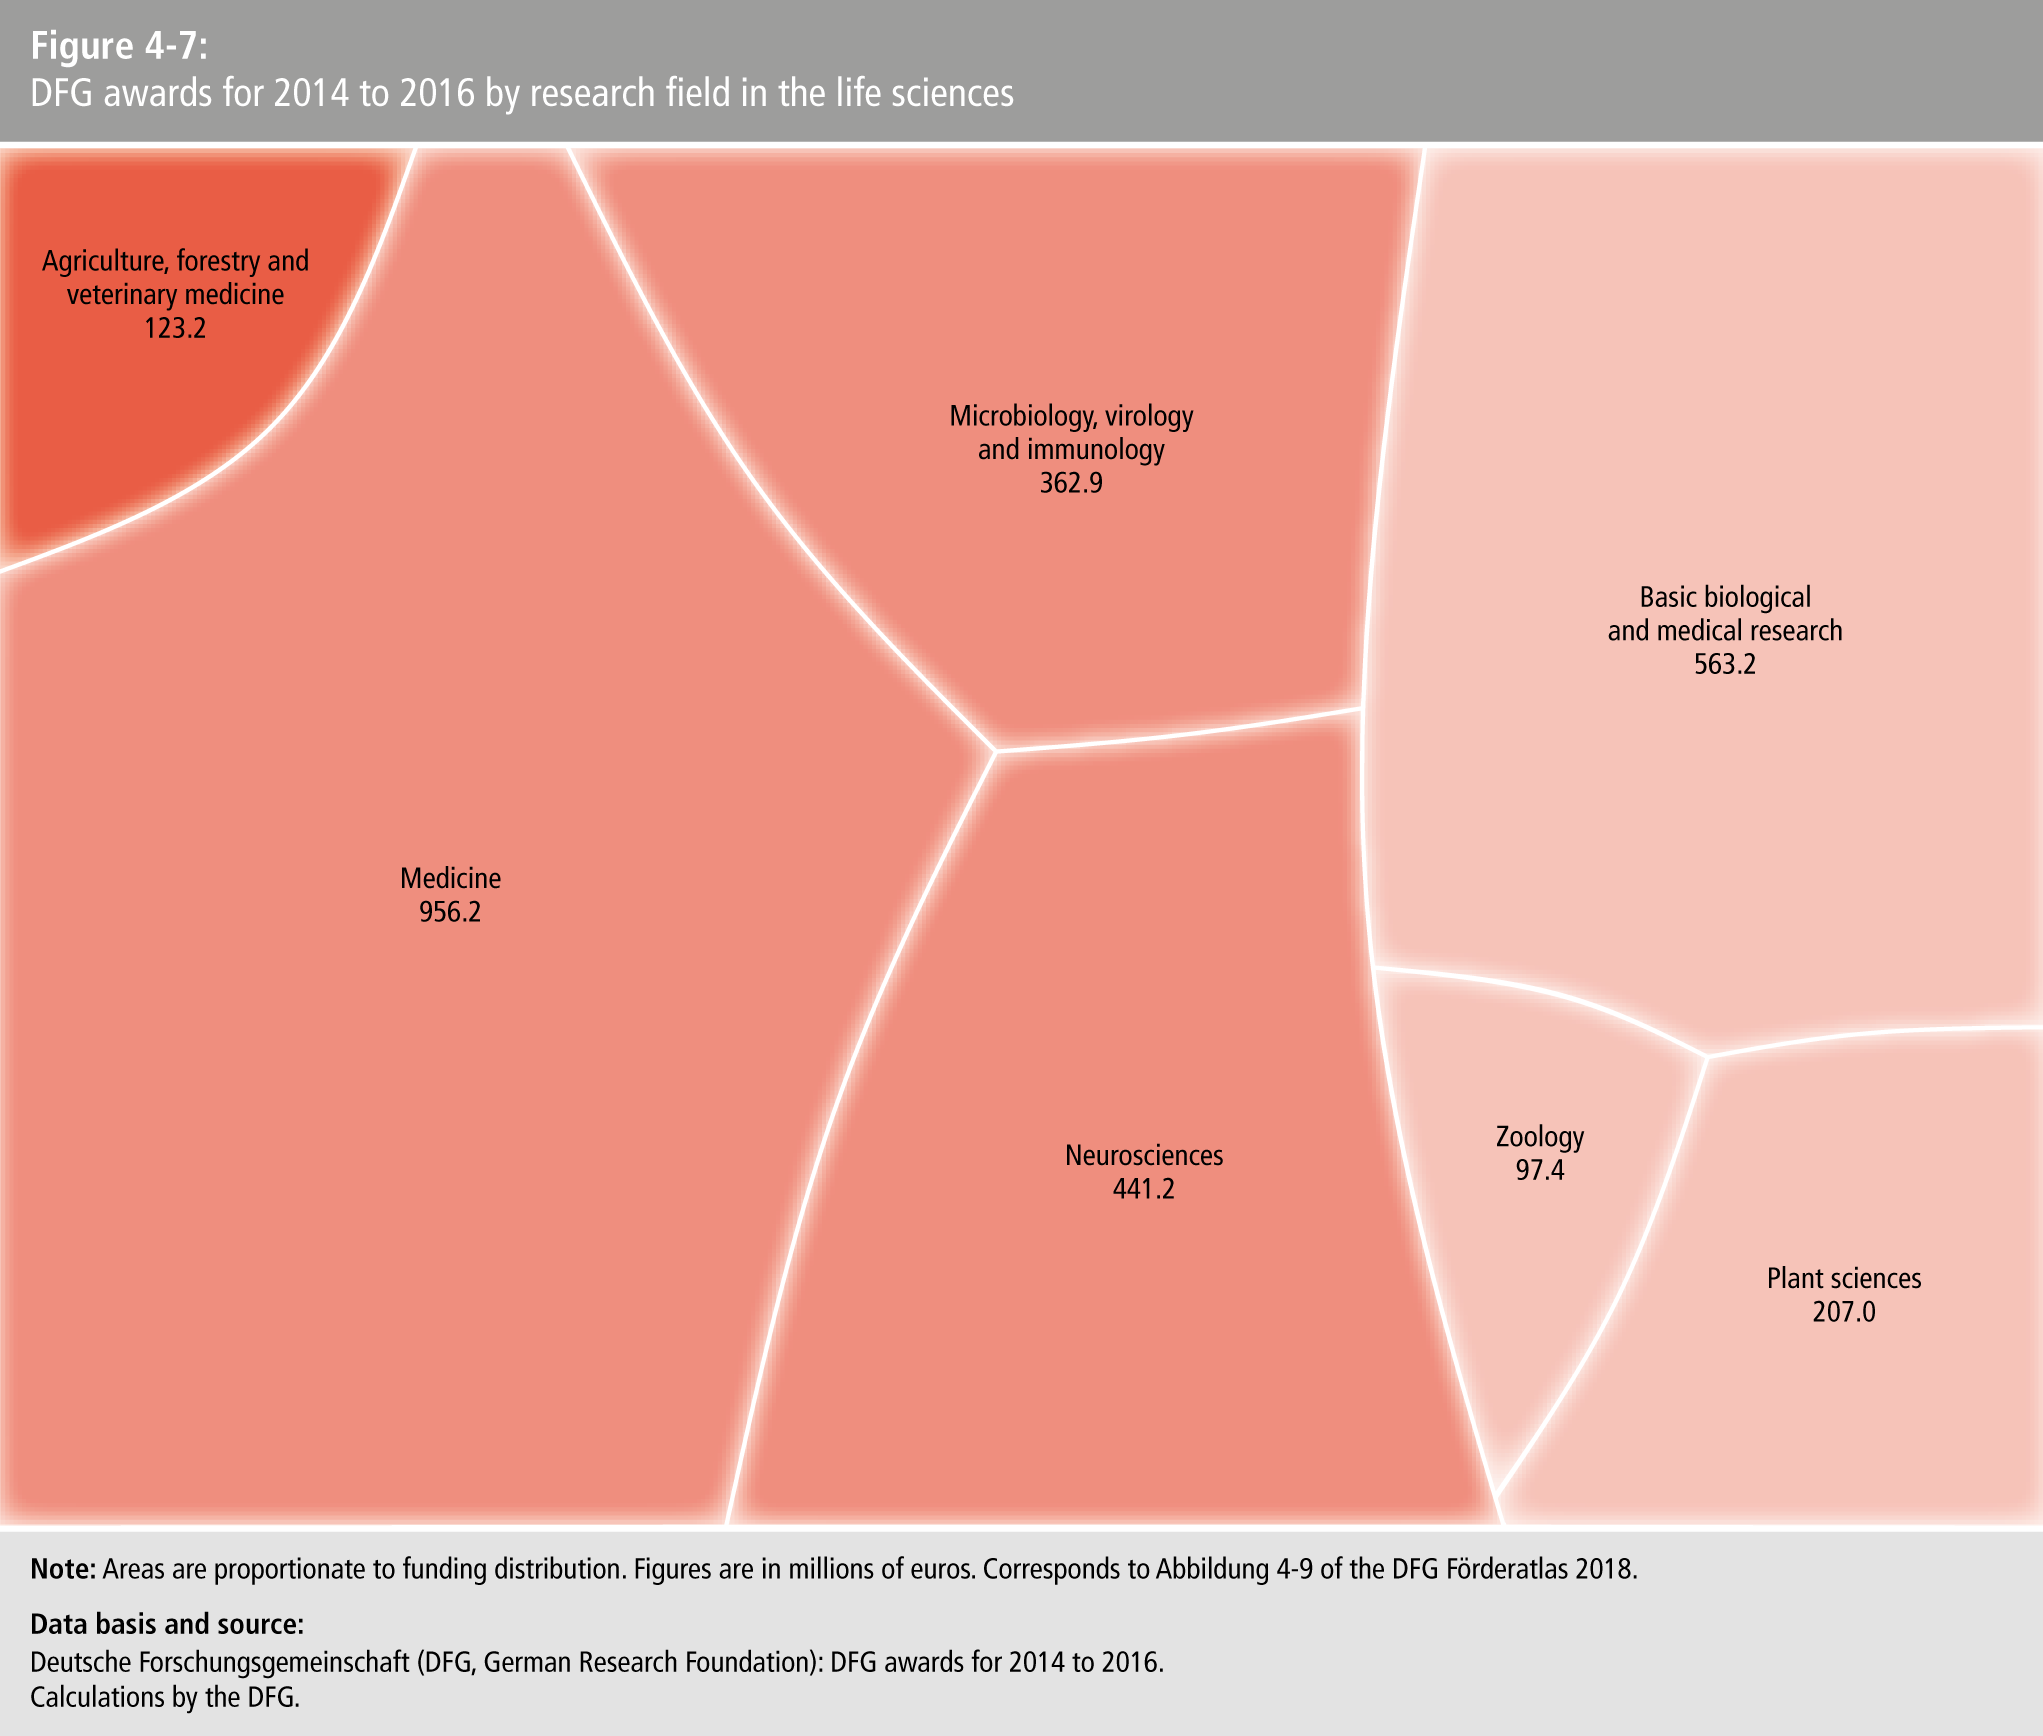
- Figure 4-7: DFG awards for 2014 to 2016 by research field in the life science
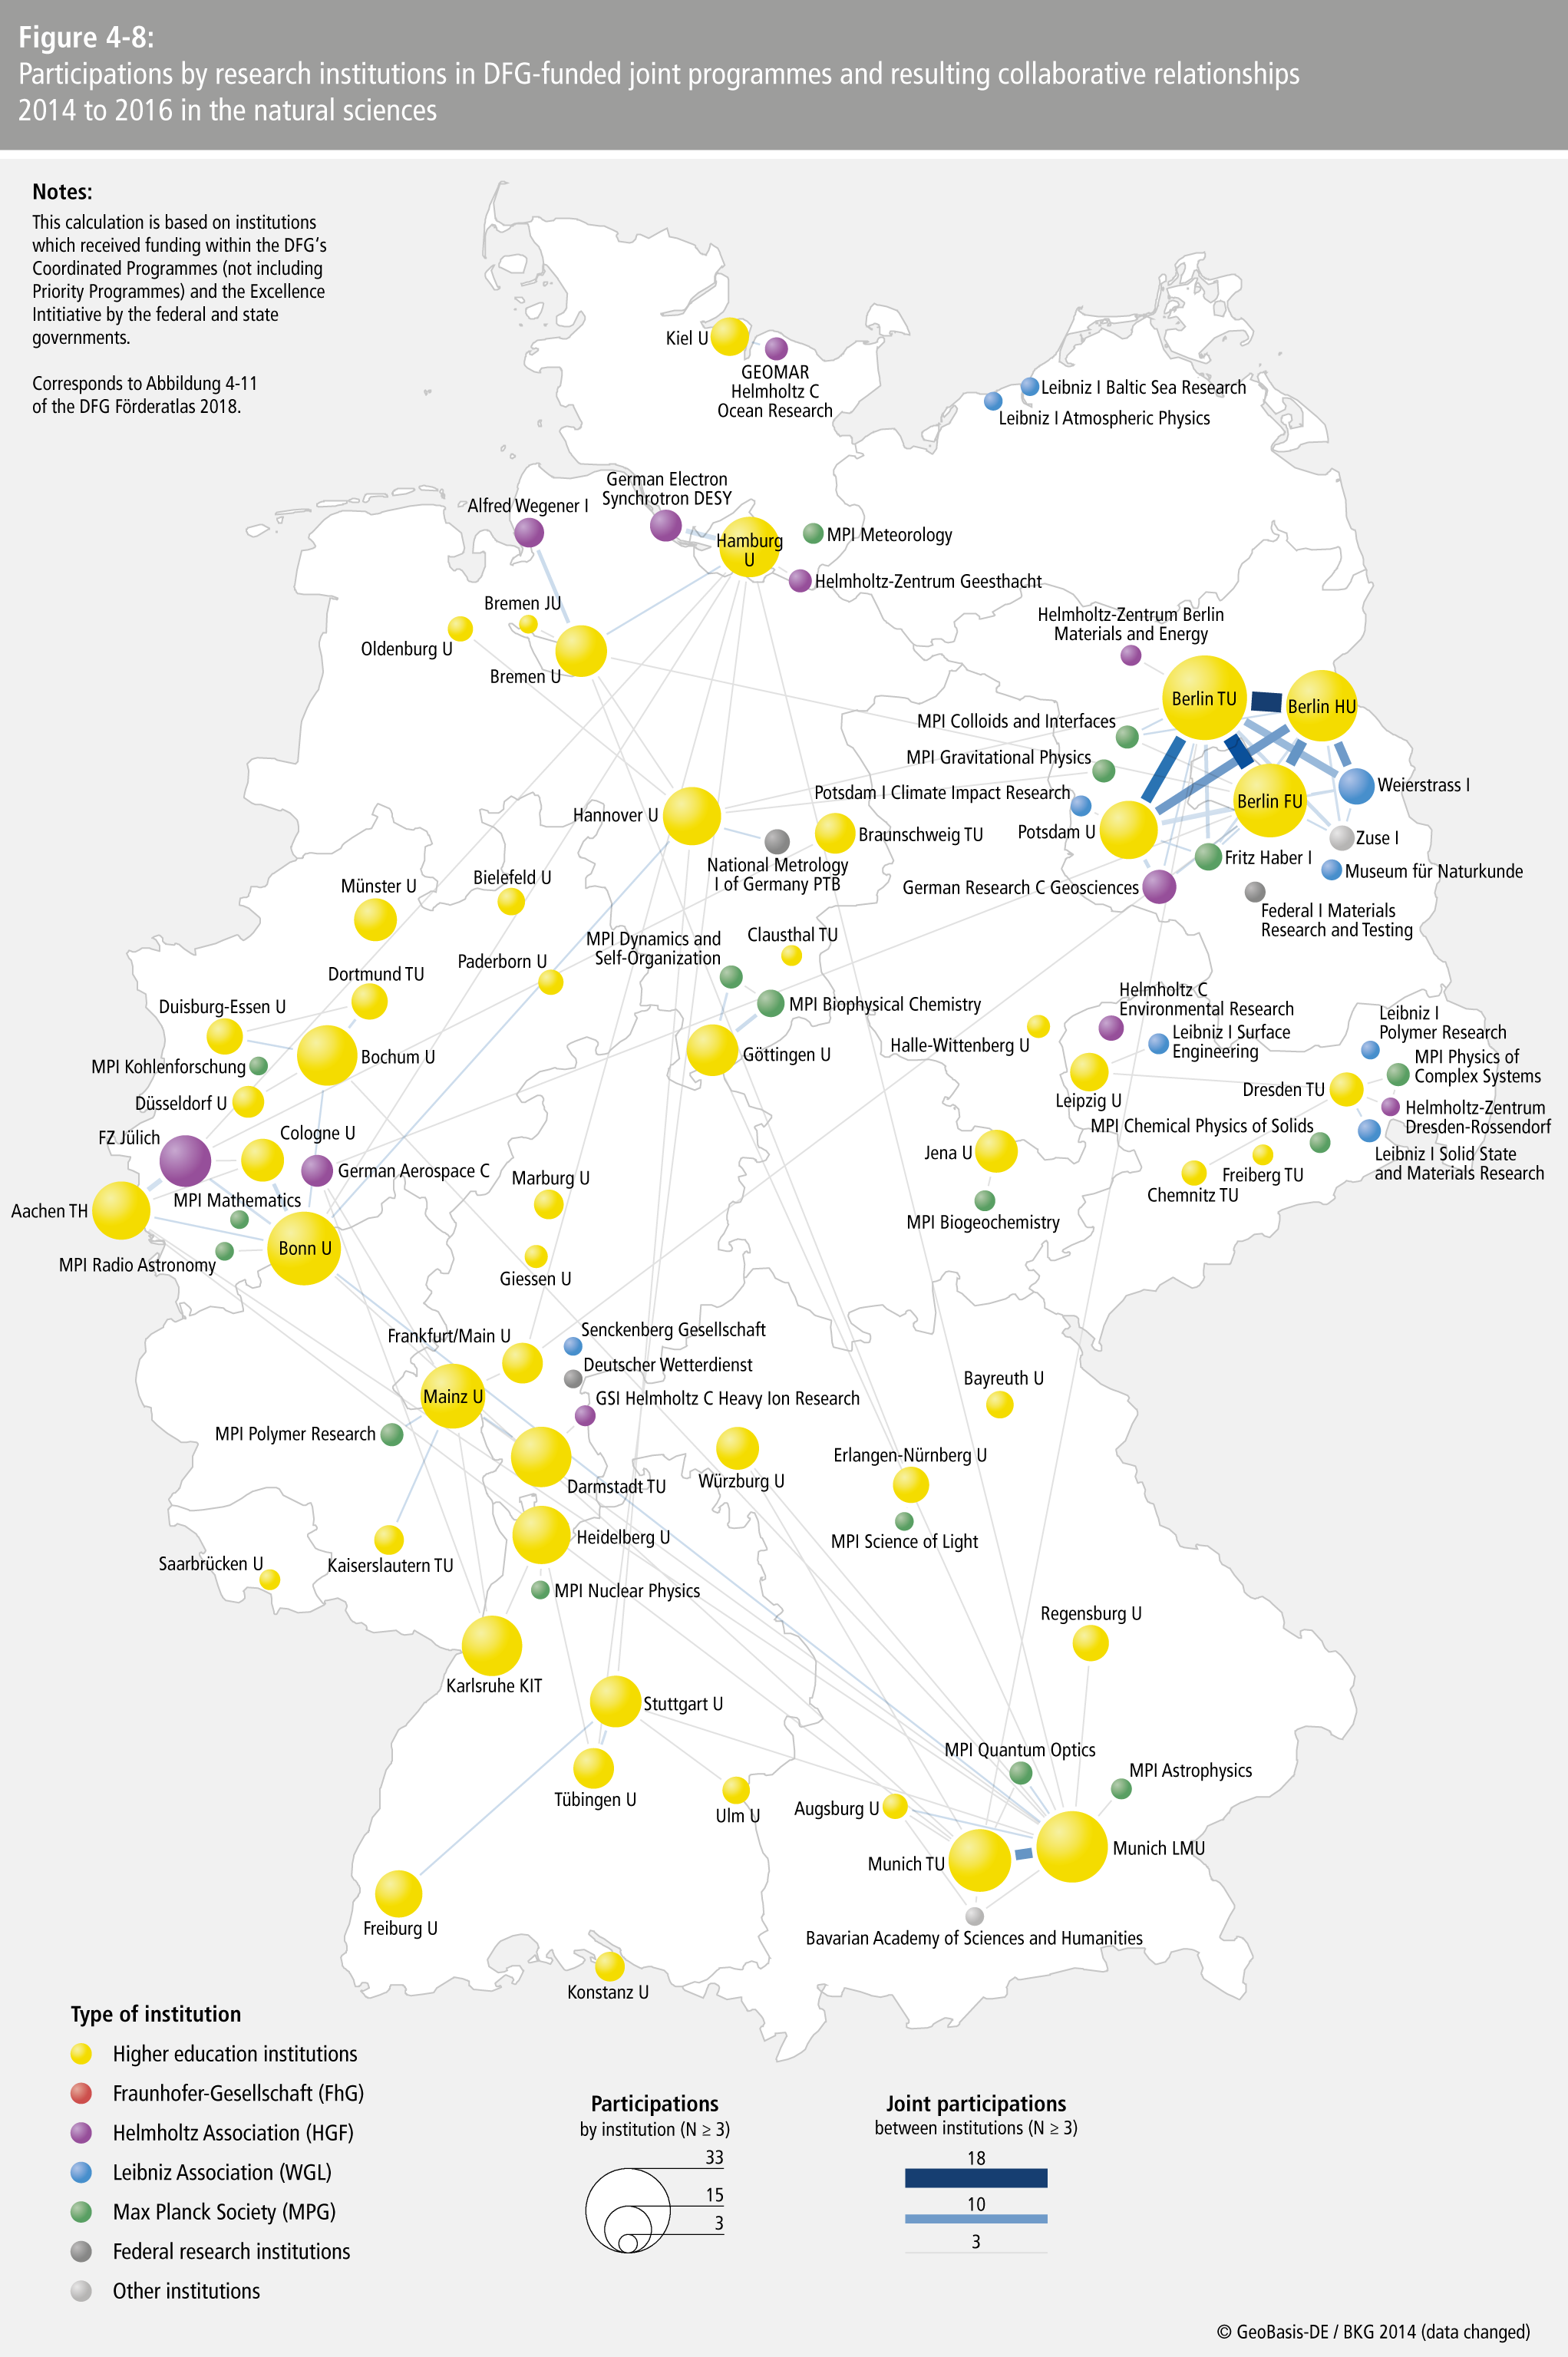
- Figure 4-8: Participations by research institutions in DFG-funded joint programmes and resulting collaborative relationships 2014 to 2016 in the natural science
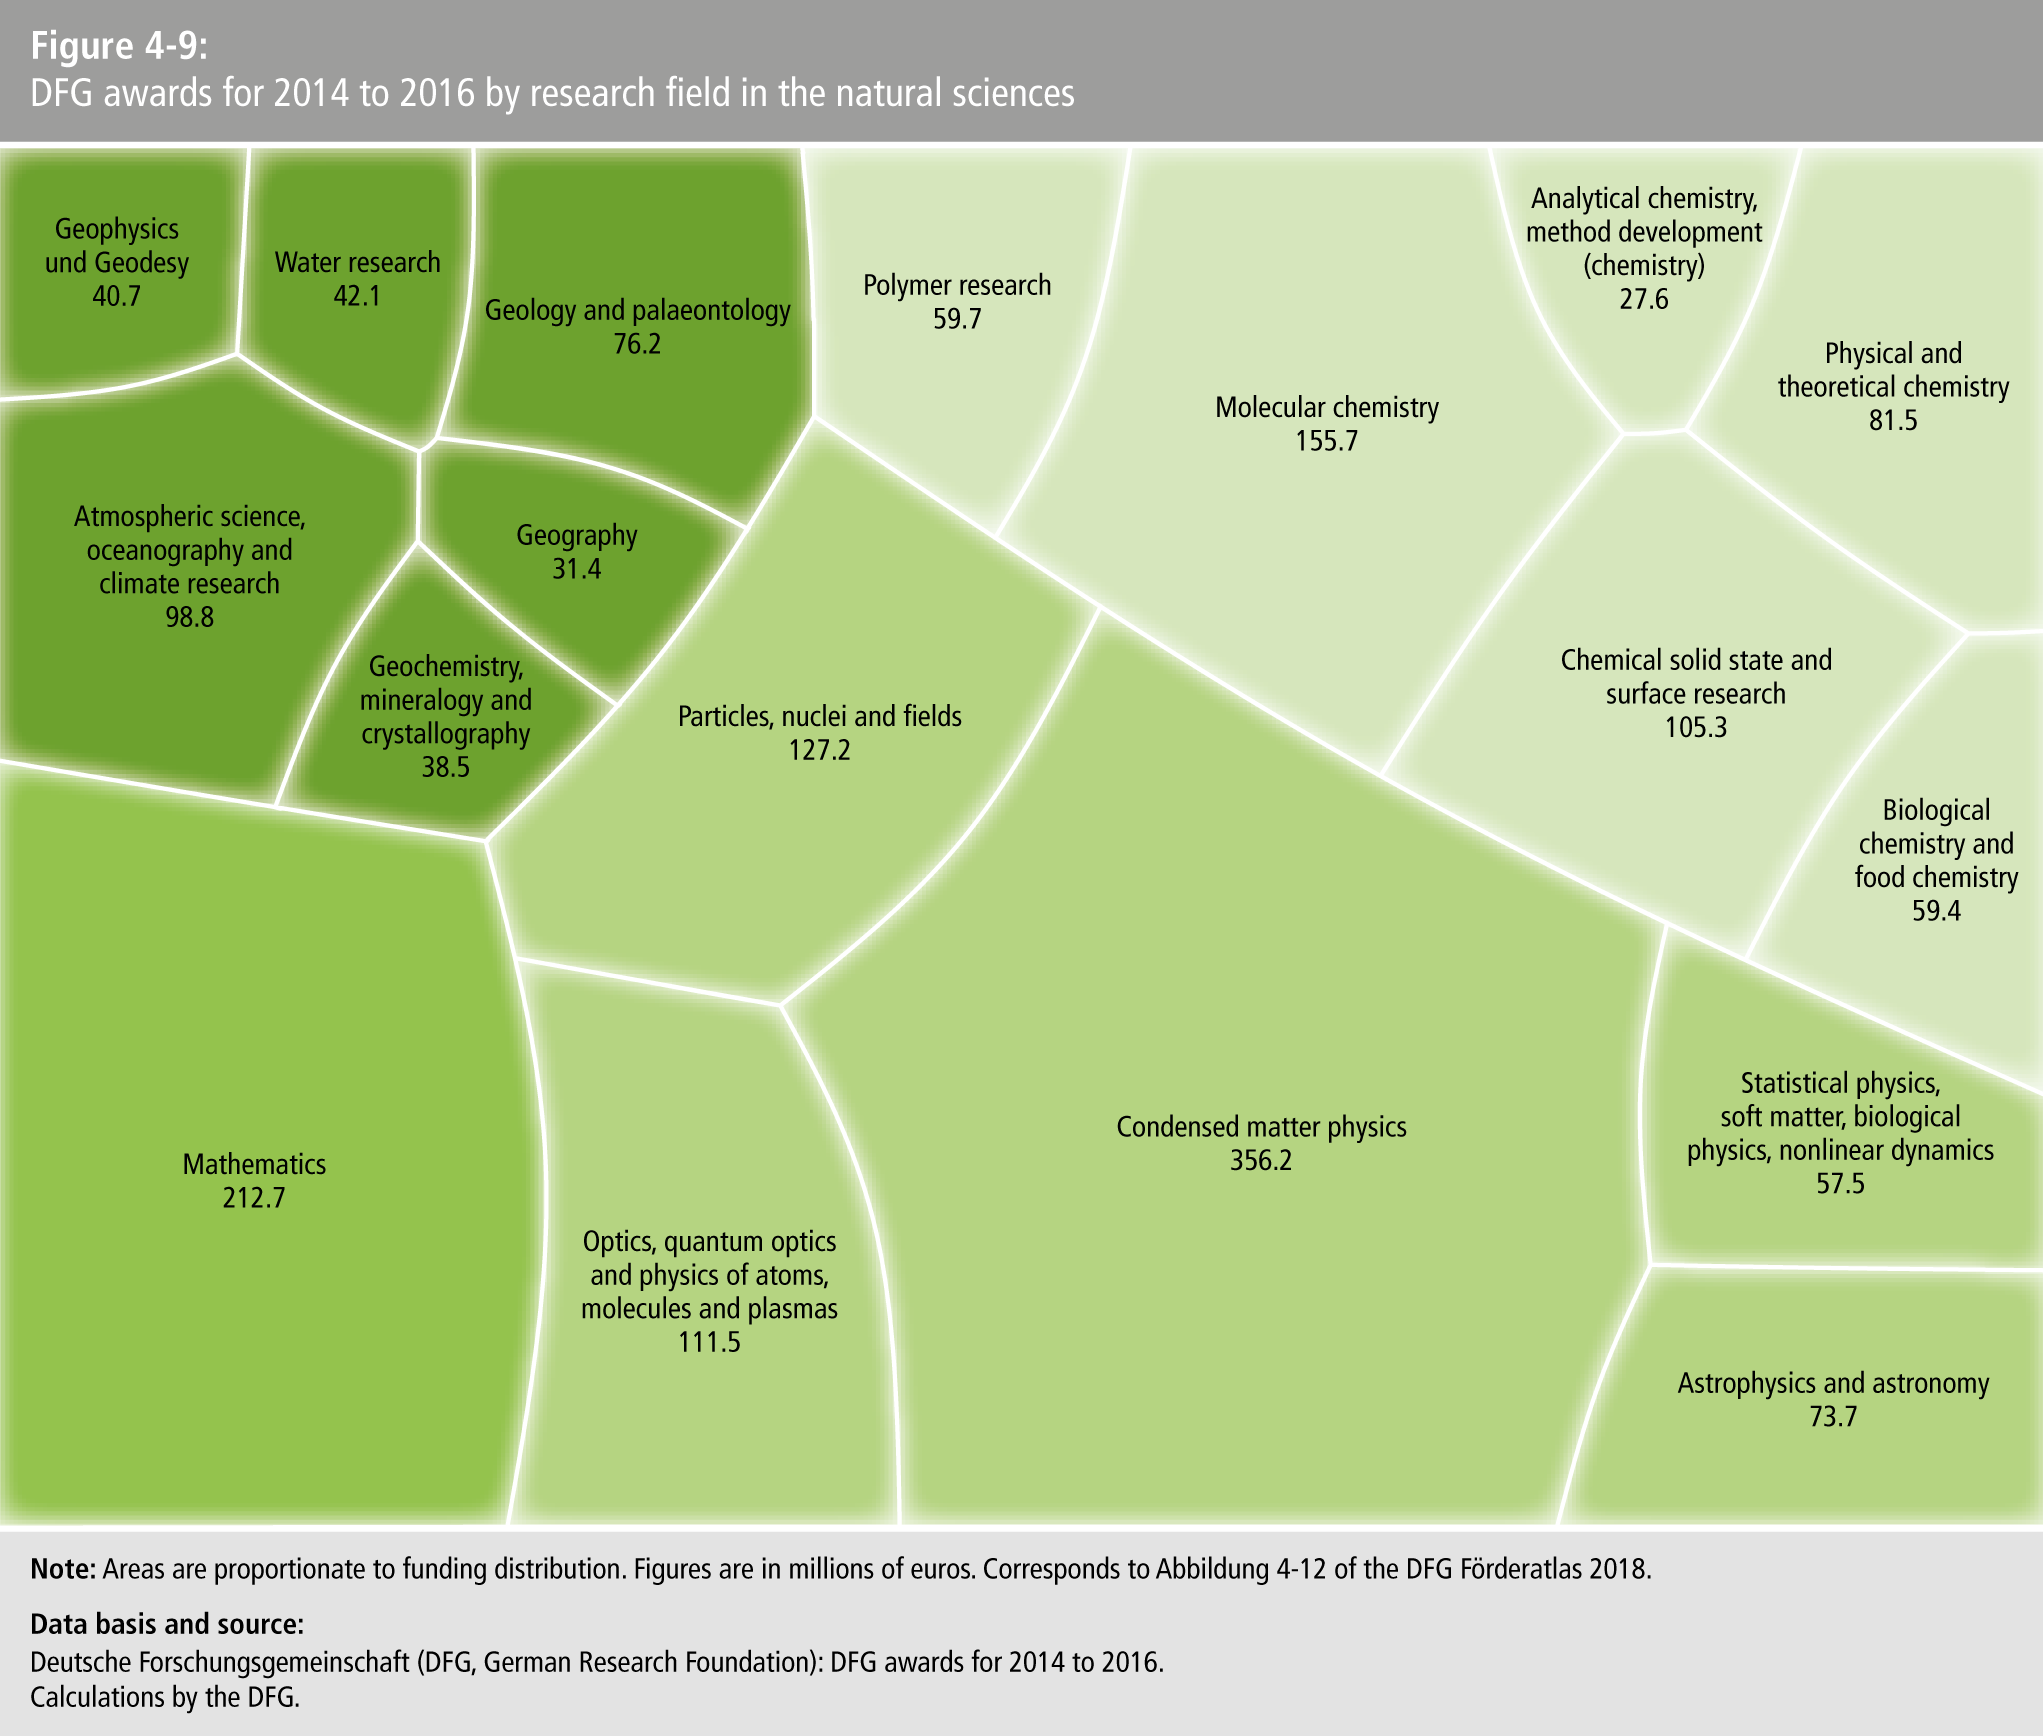
- Figure 4-9: DFG awards for 2014 to 2016 by research field in the natural science
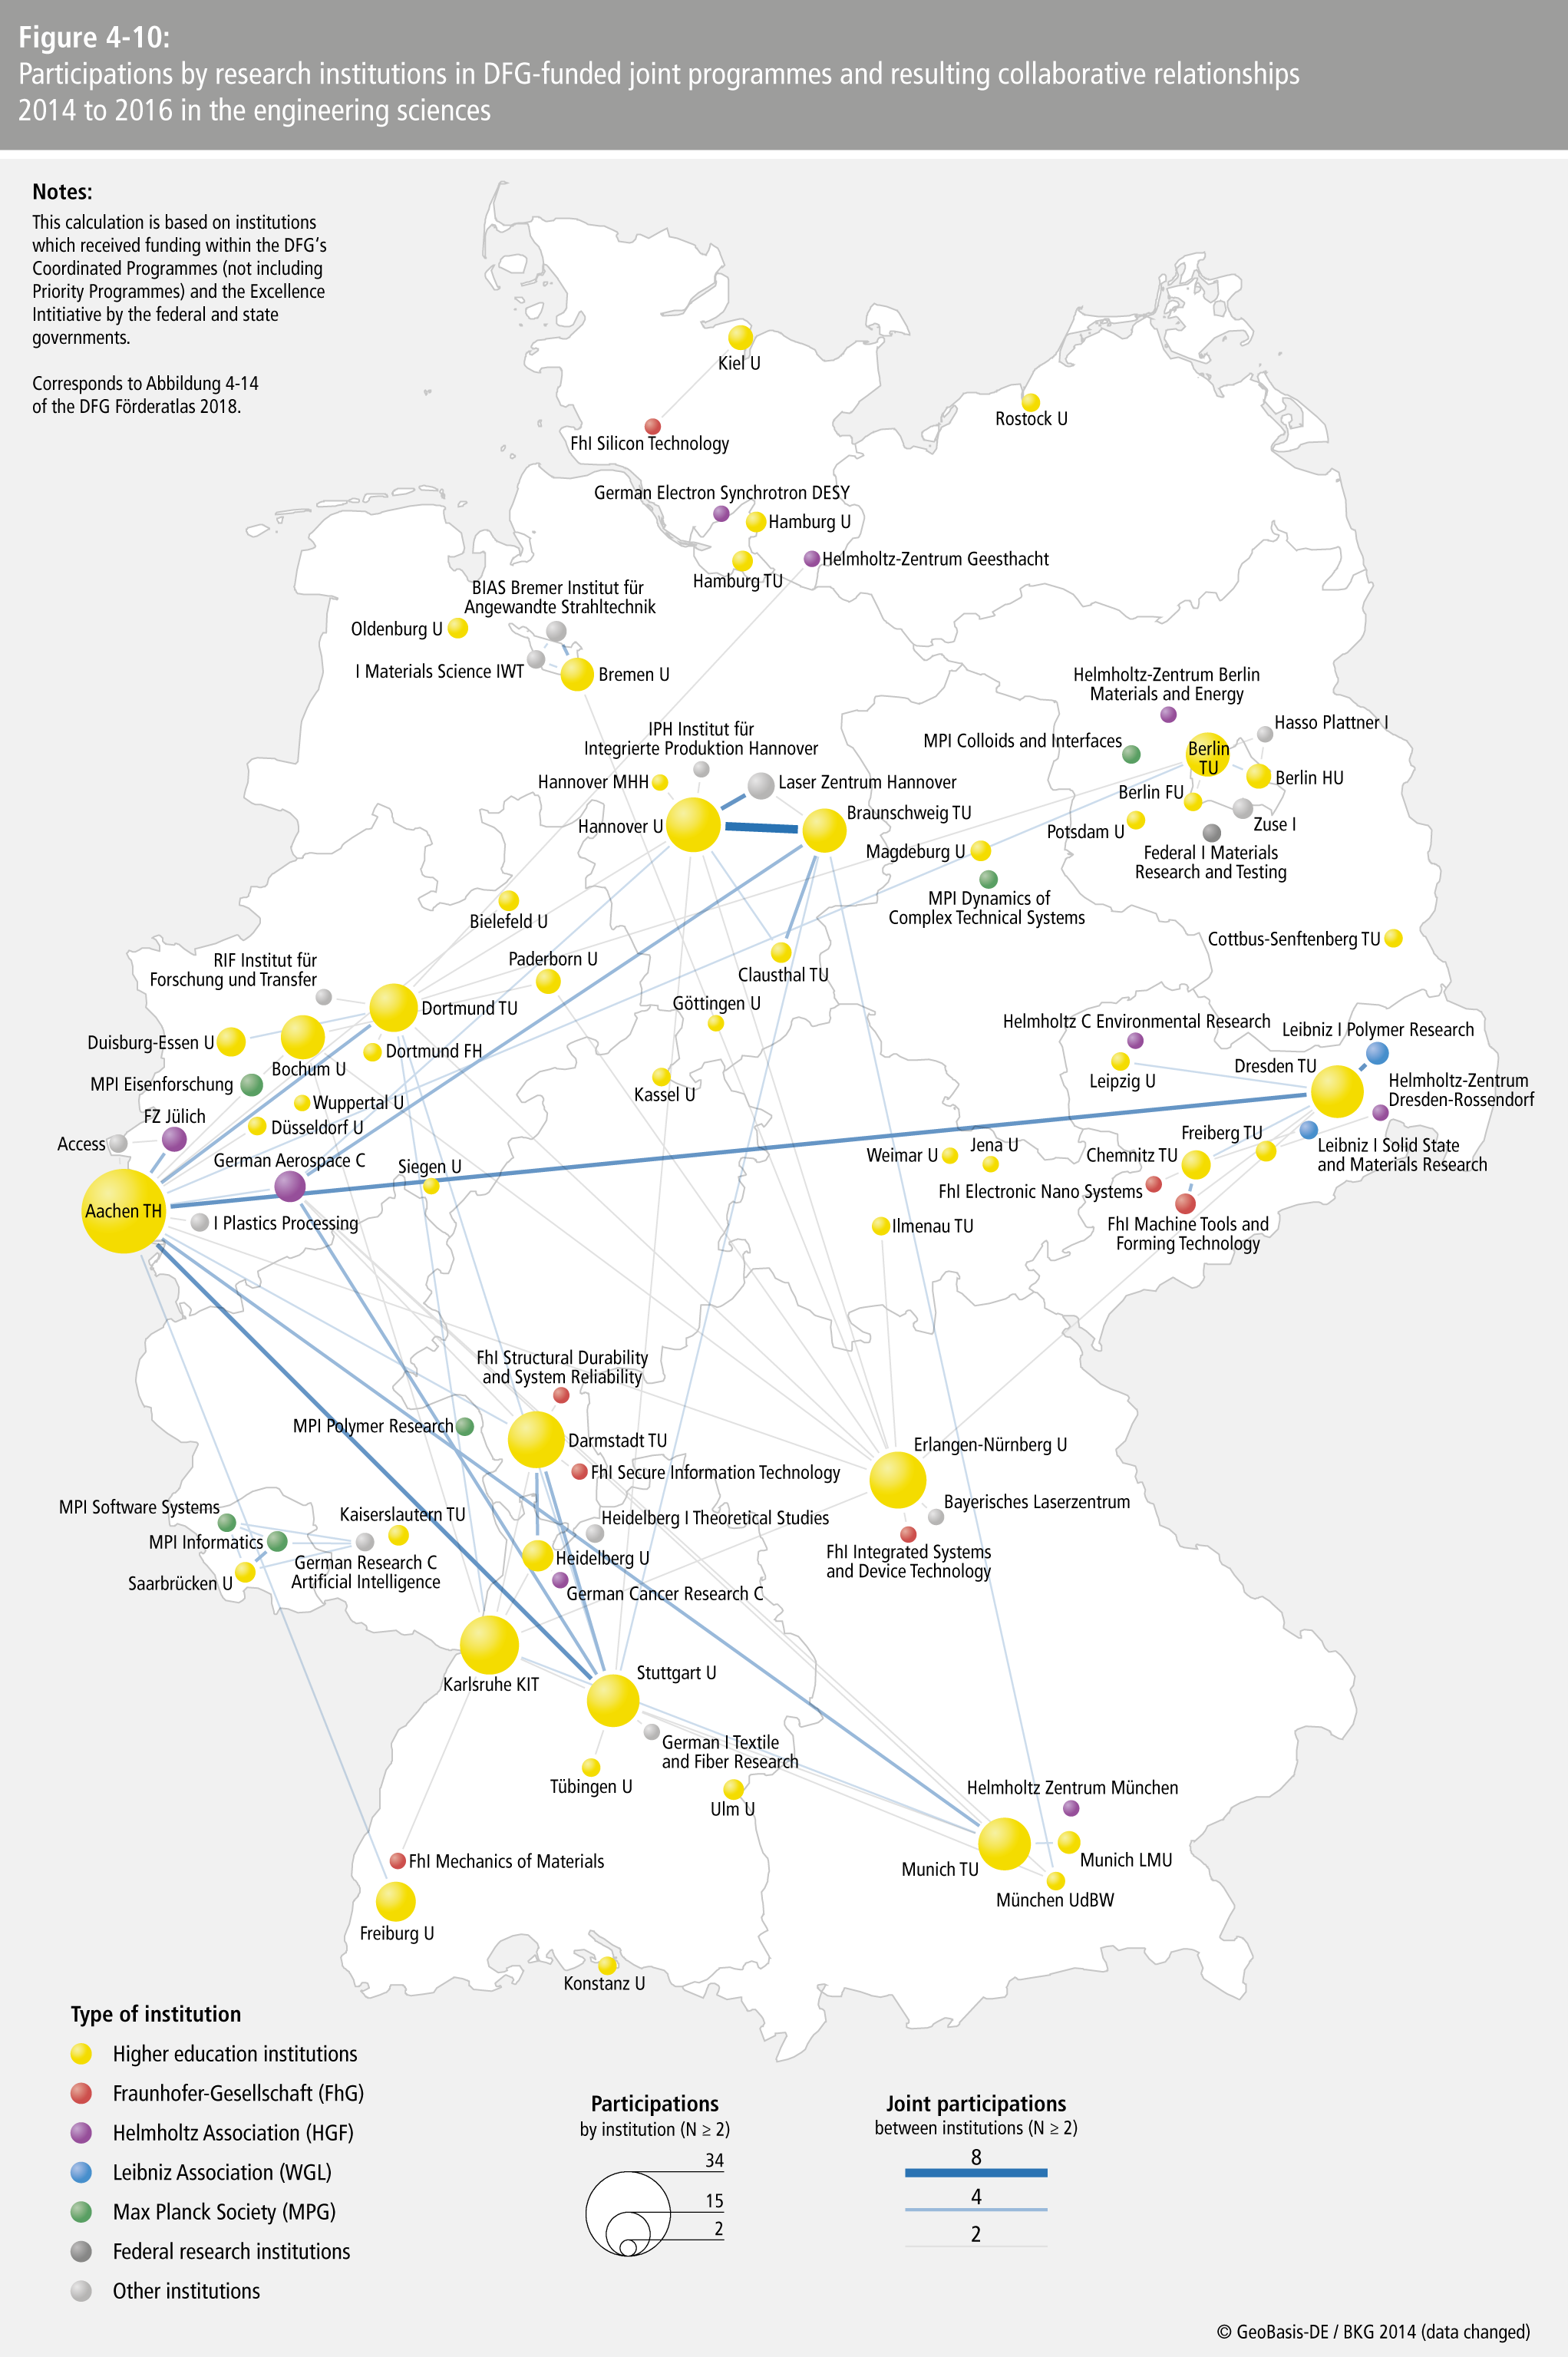
- Figure 4-10: Participations by research institutions in DFG-funded joint programmes and resulting collaborative relationships 2014 to 2016 in the engineering science
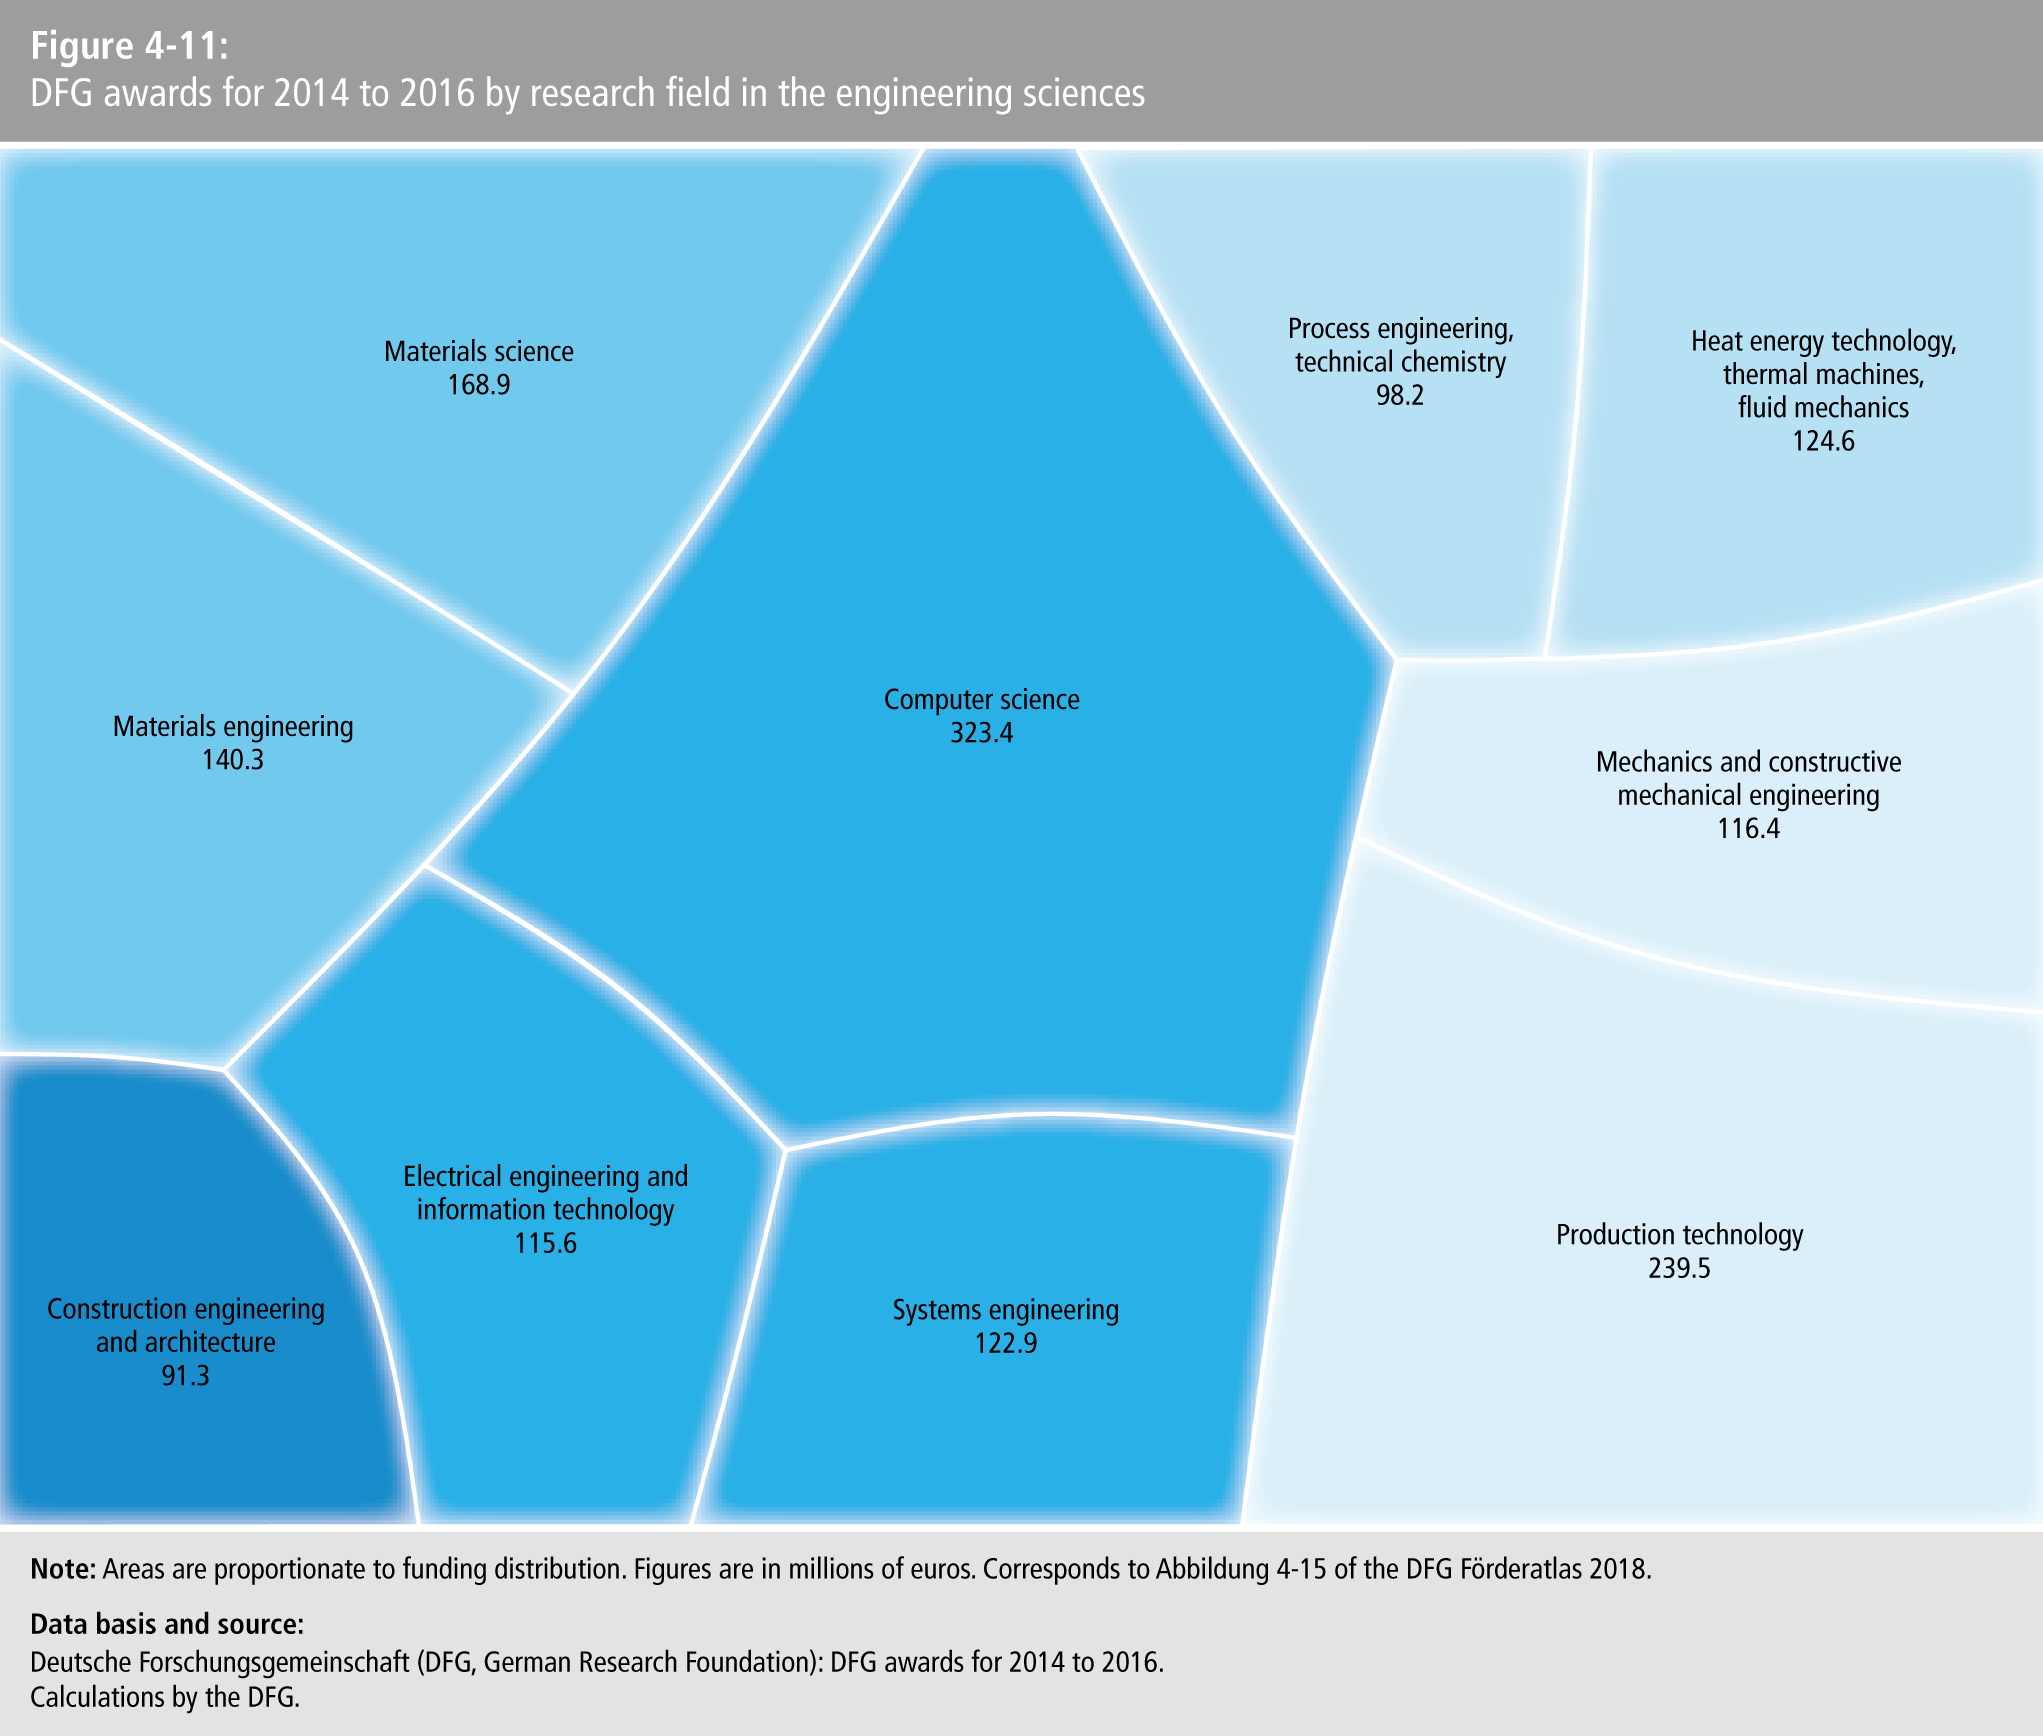
- Figure 4-11: DFG awards for 2014 to 2016 by research field in the engineering science
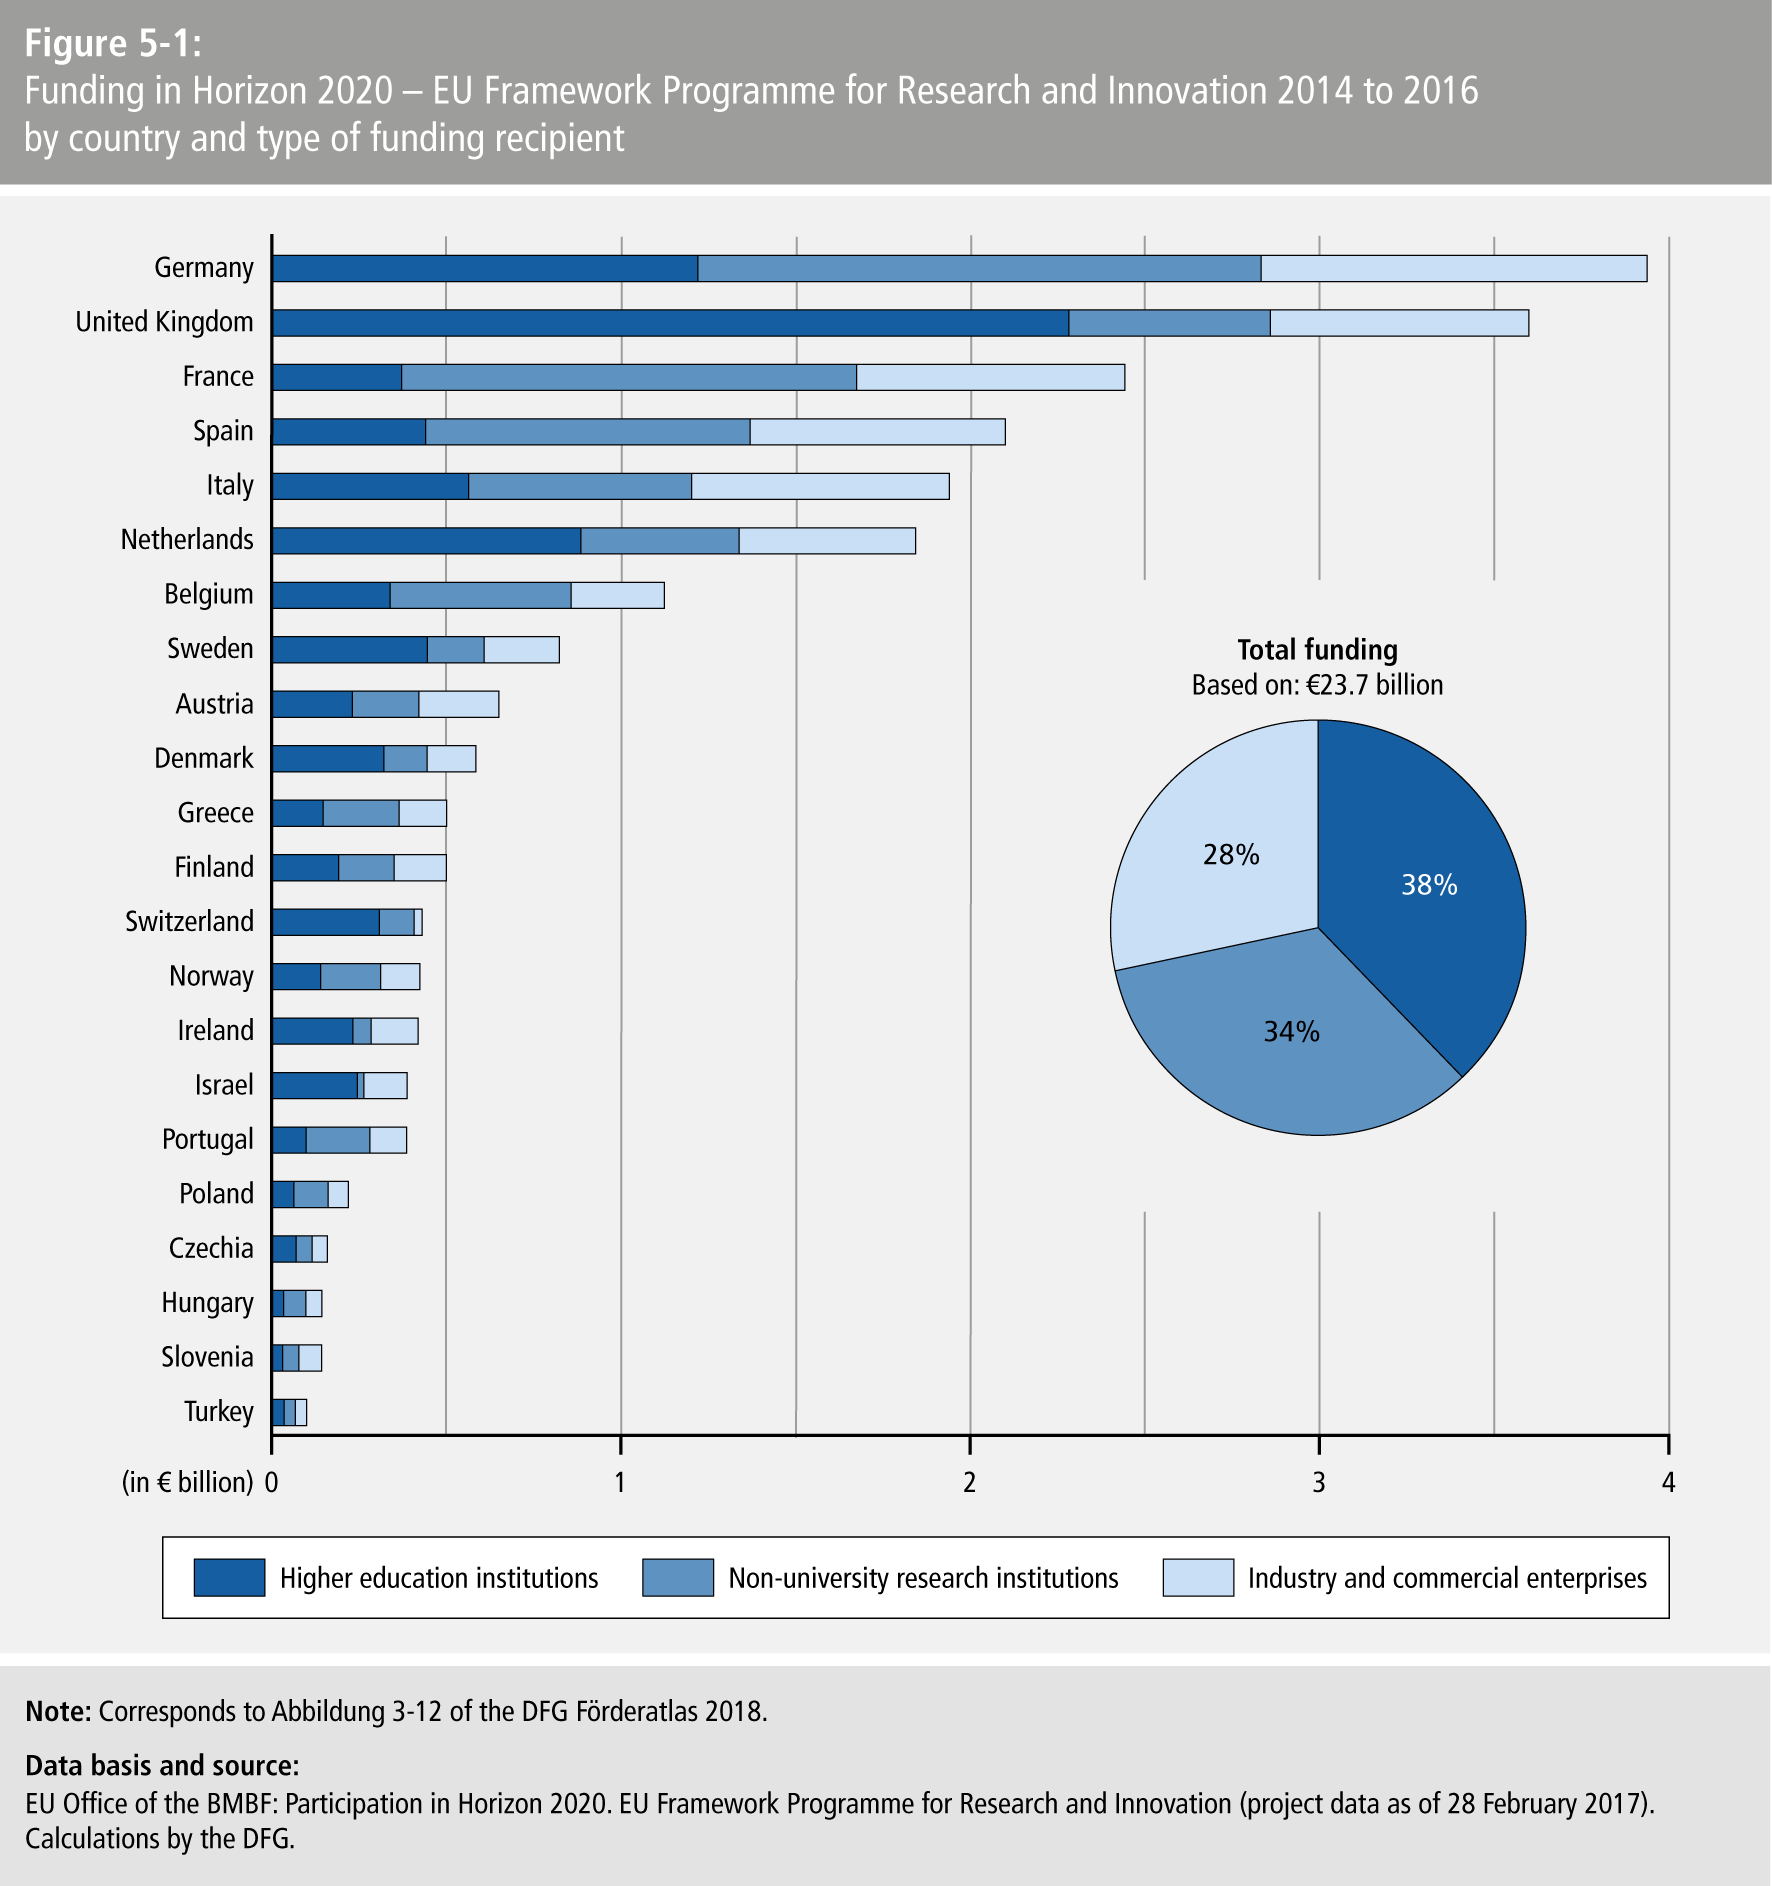
- Figure 5-1: Funding in Horizon 2020 – EU Framework Programme for Research and Innovation 2014 to 2016 by country and type of funding recipien
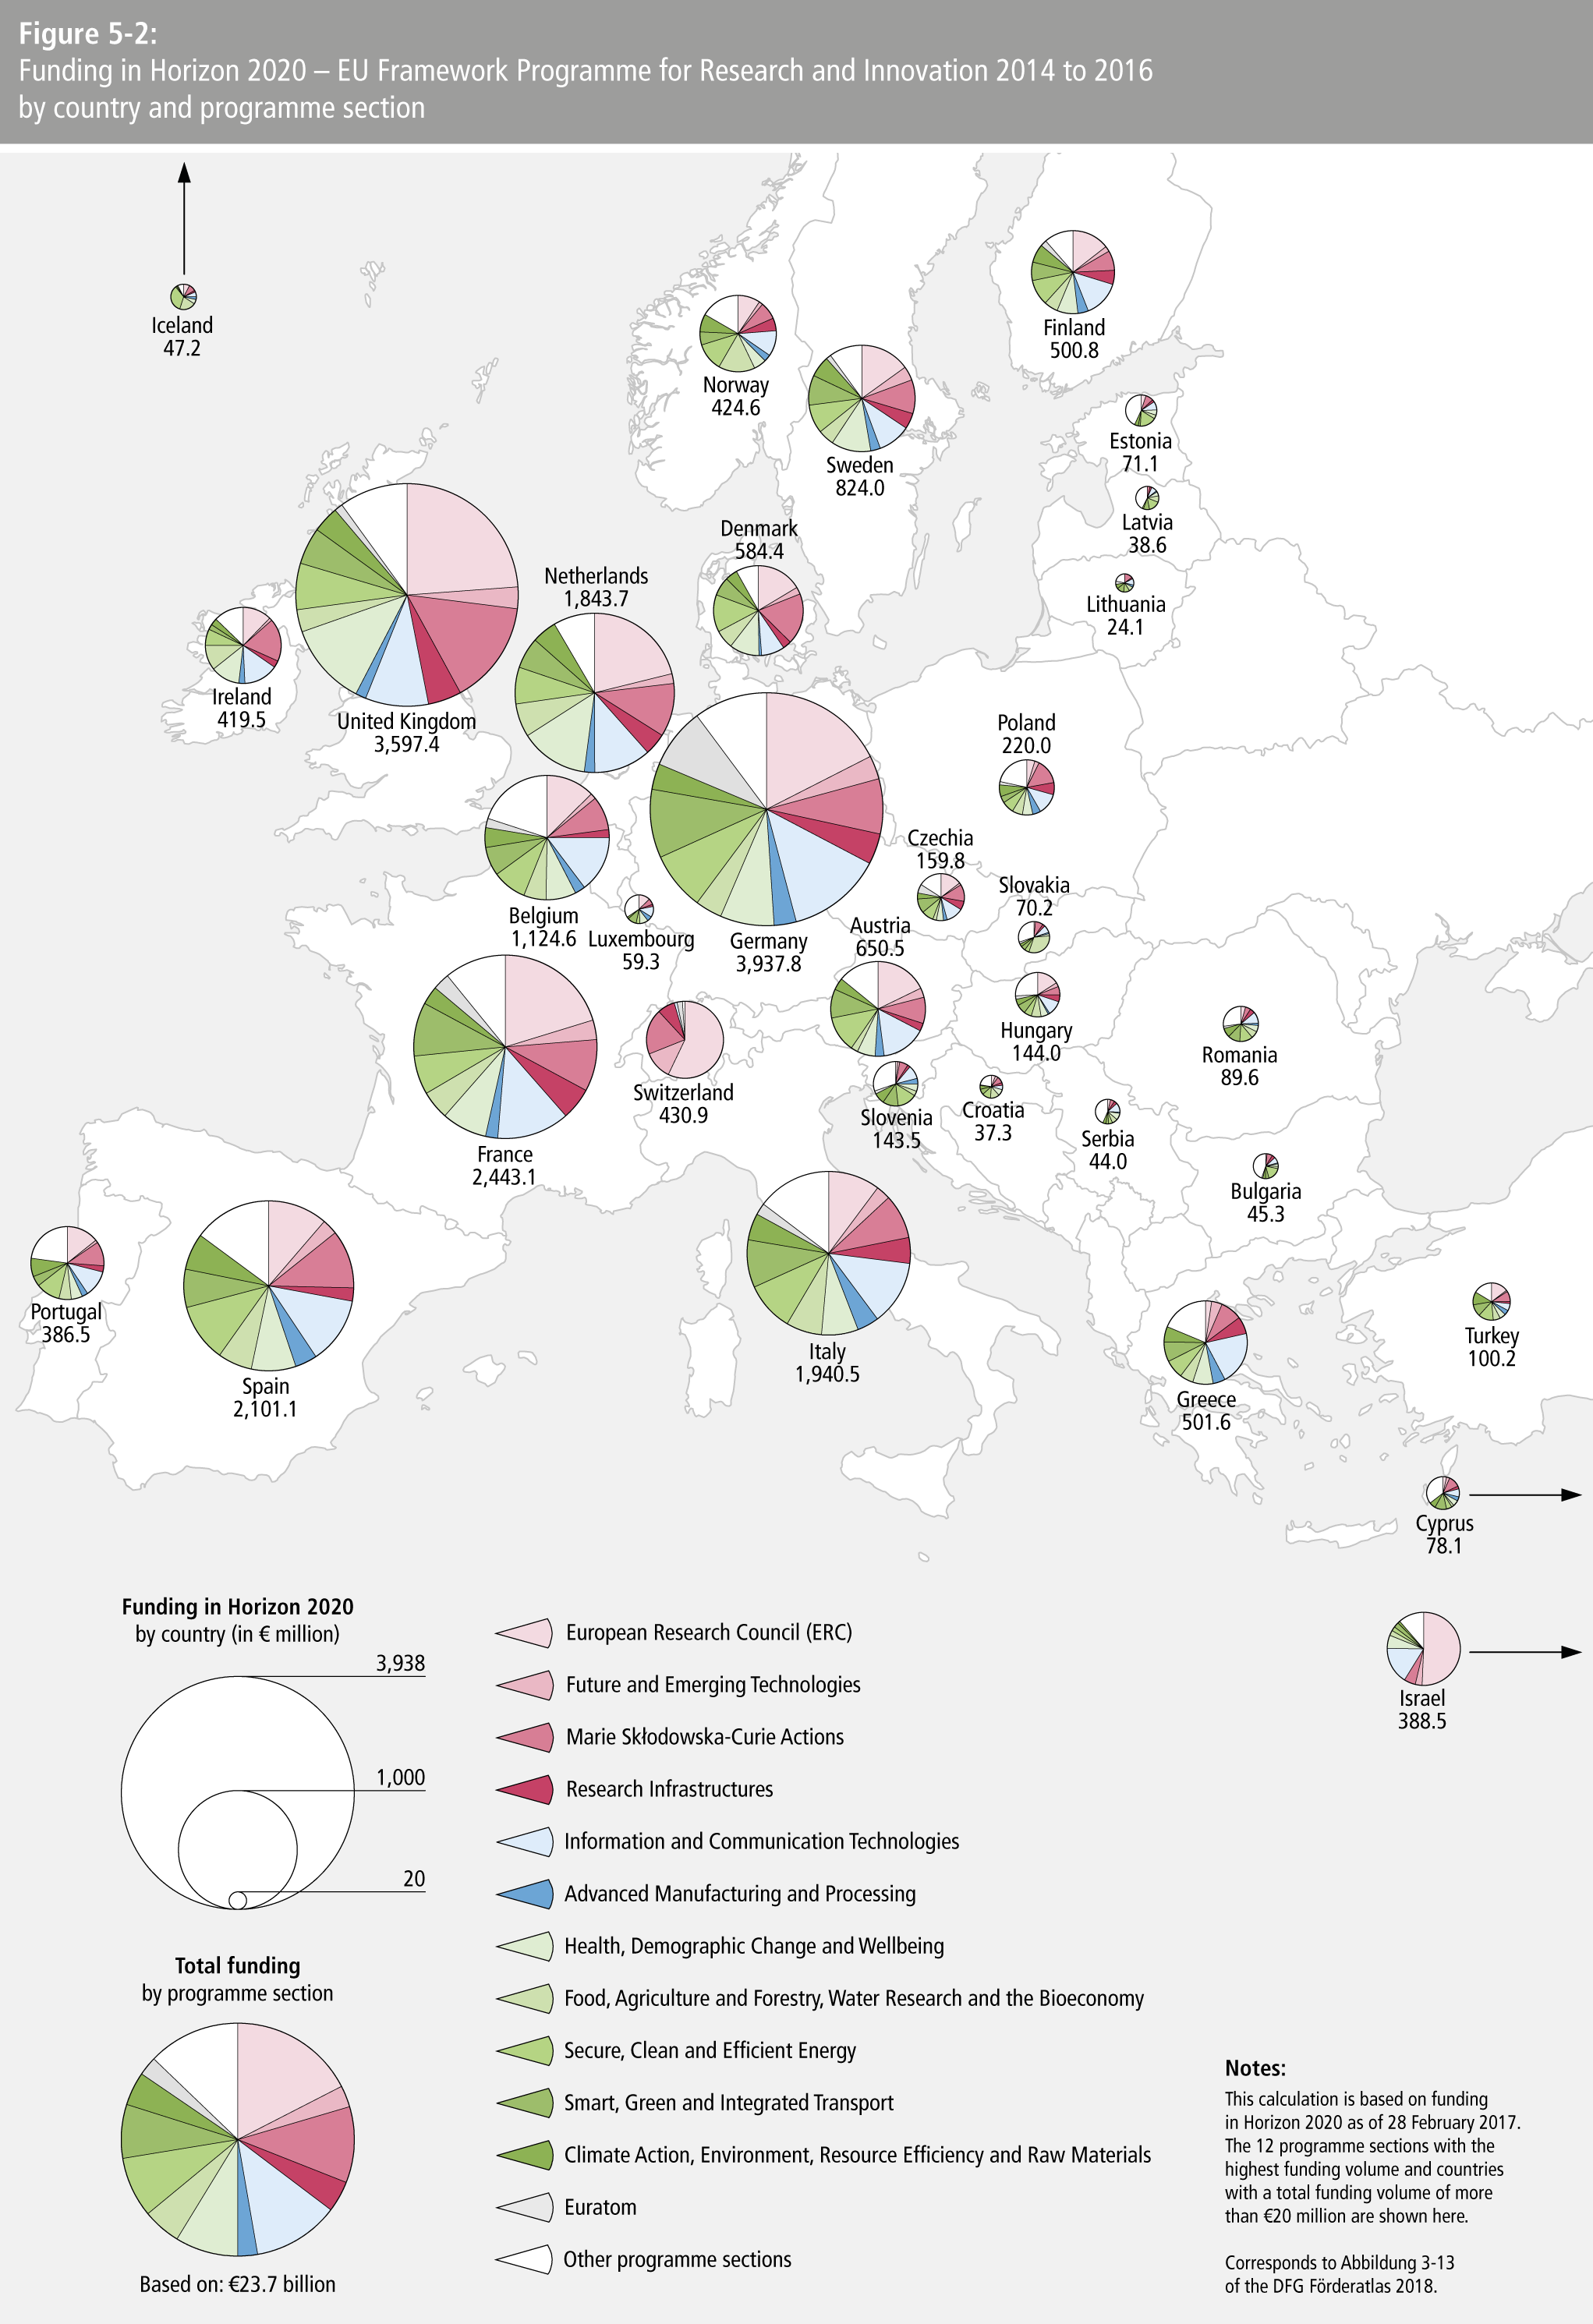
- Figure 5-2: Funding in Horizon 2020 – EU Framework Programme for Research and Innovation 2014 to 2016 by country and programme sectio
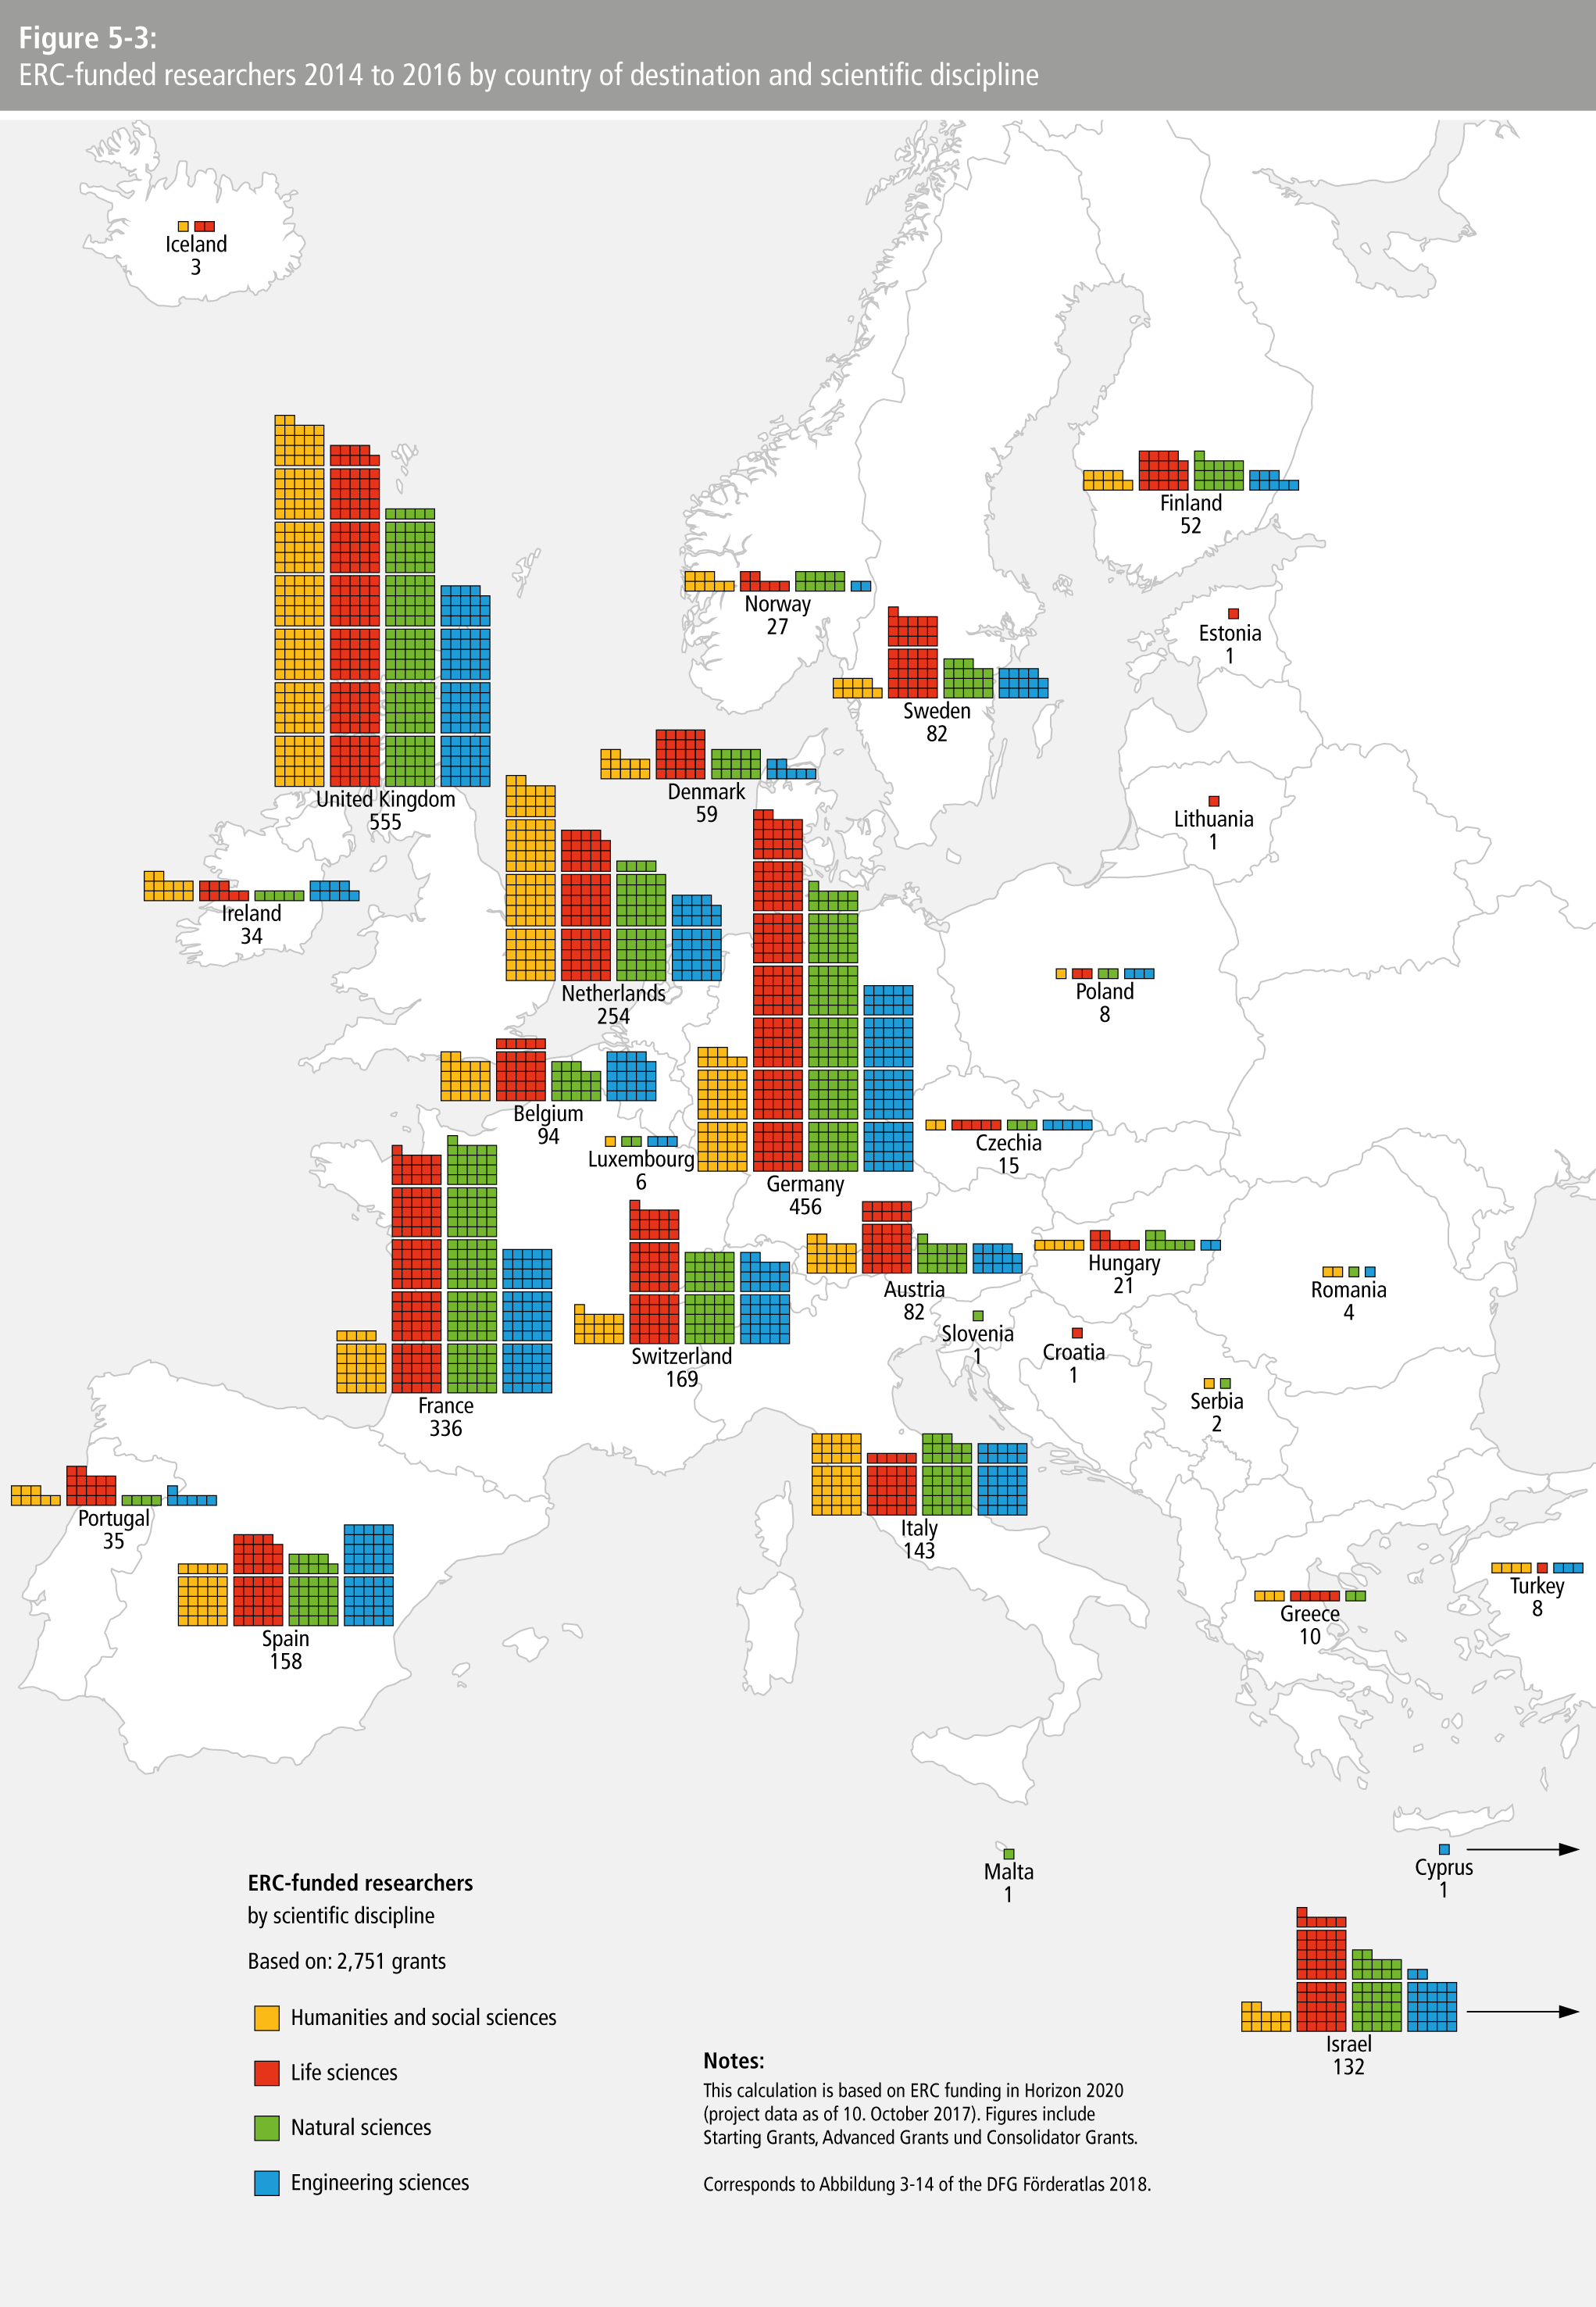
- Figure 5-3: ERC-funded researchers 2014 to 2016 by country of destination and scientific disciplin
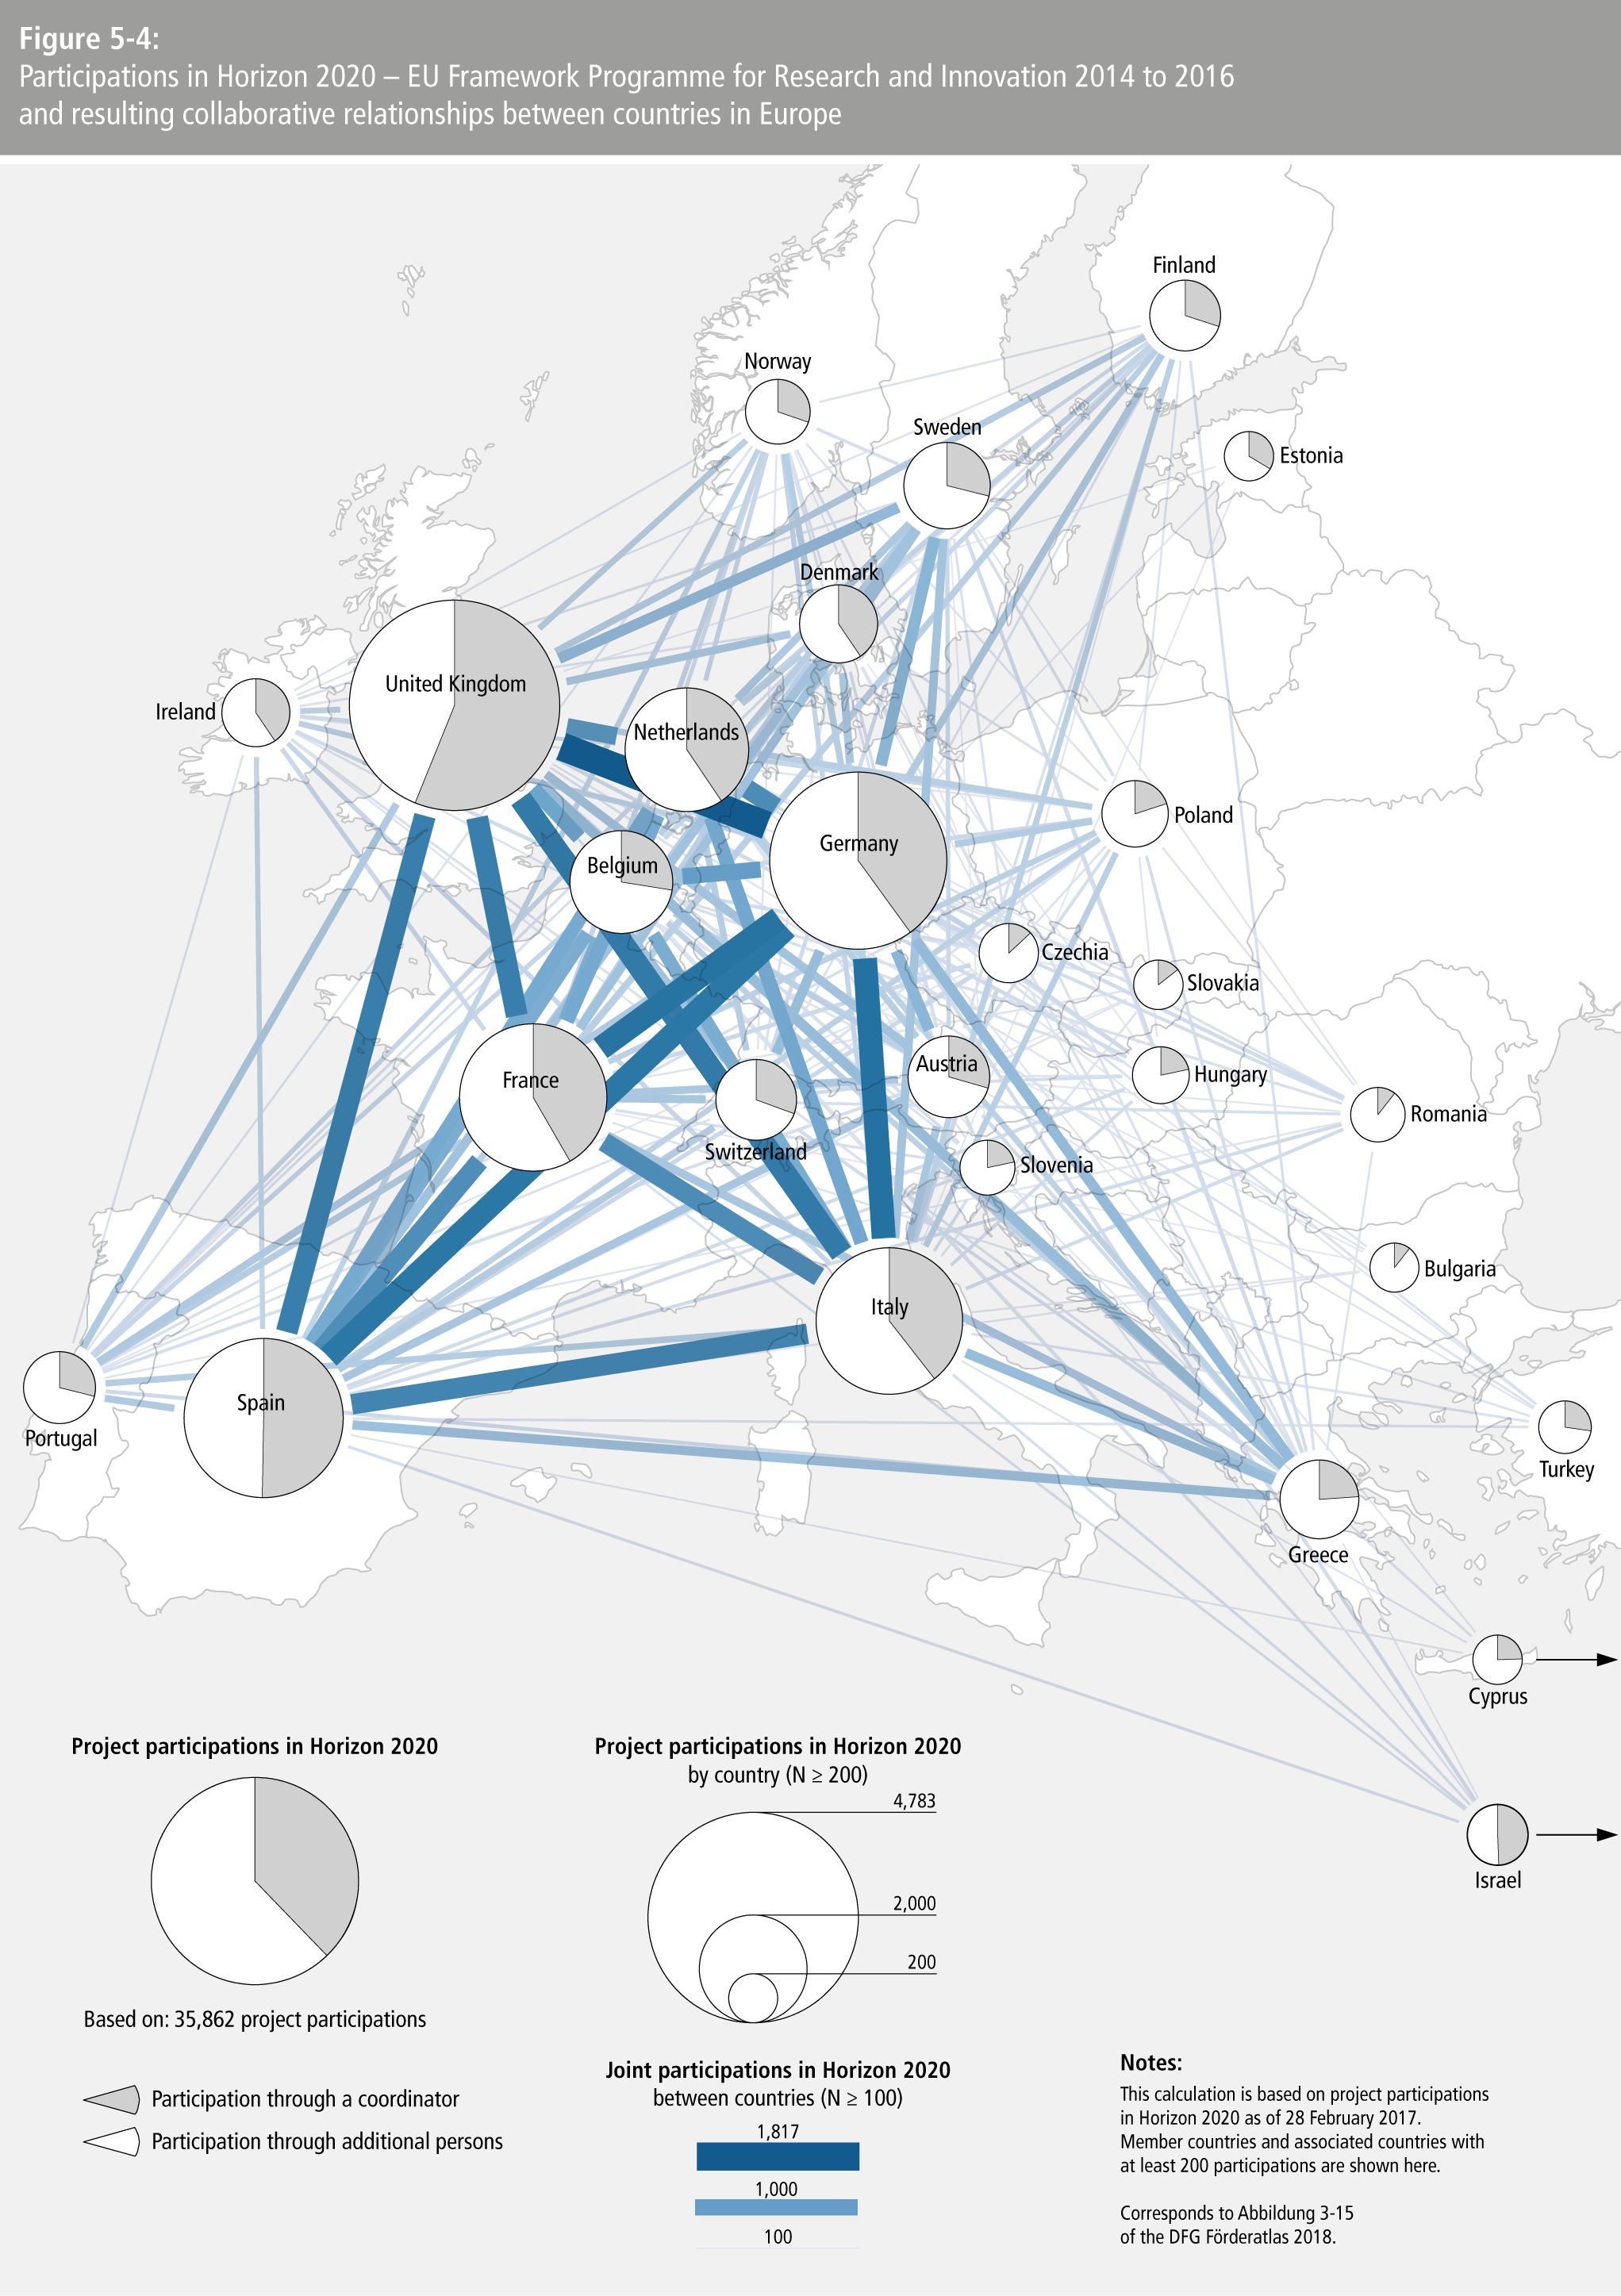
- Figure 5-4: Participations in Horizon 2020 – EU Framework Programme for Research and Innovation 2014 to 2016 and resulting collaborative relationships between countries in Europ
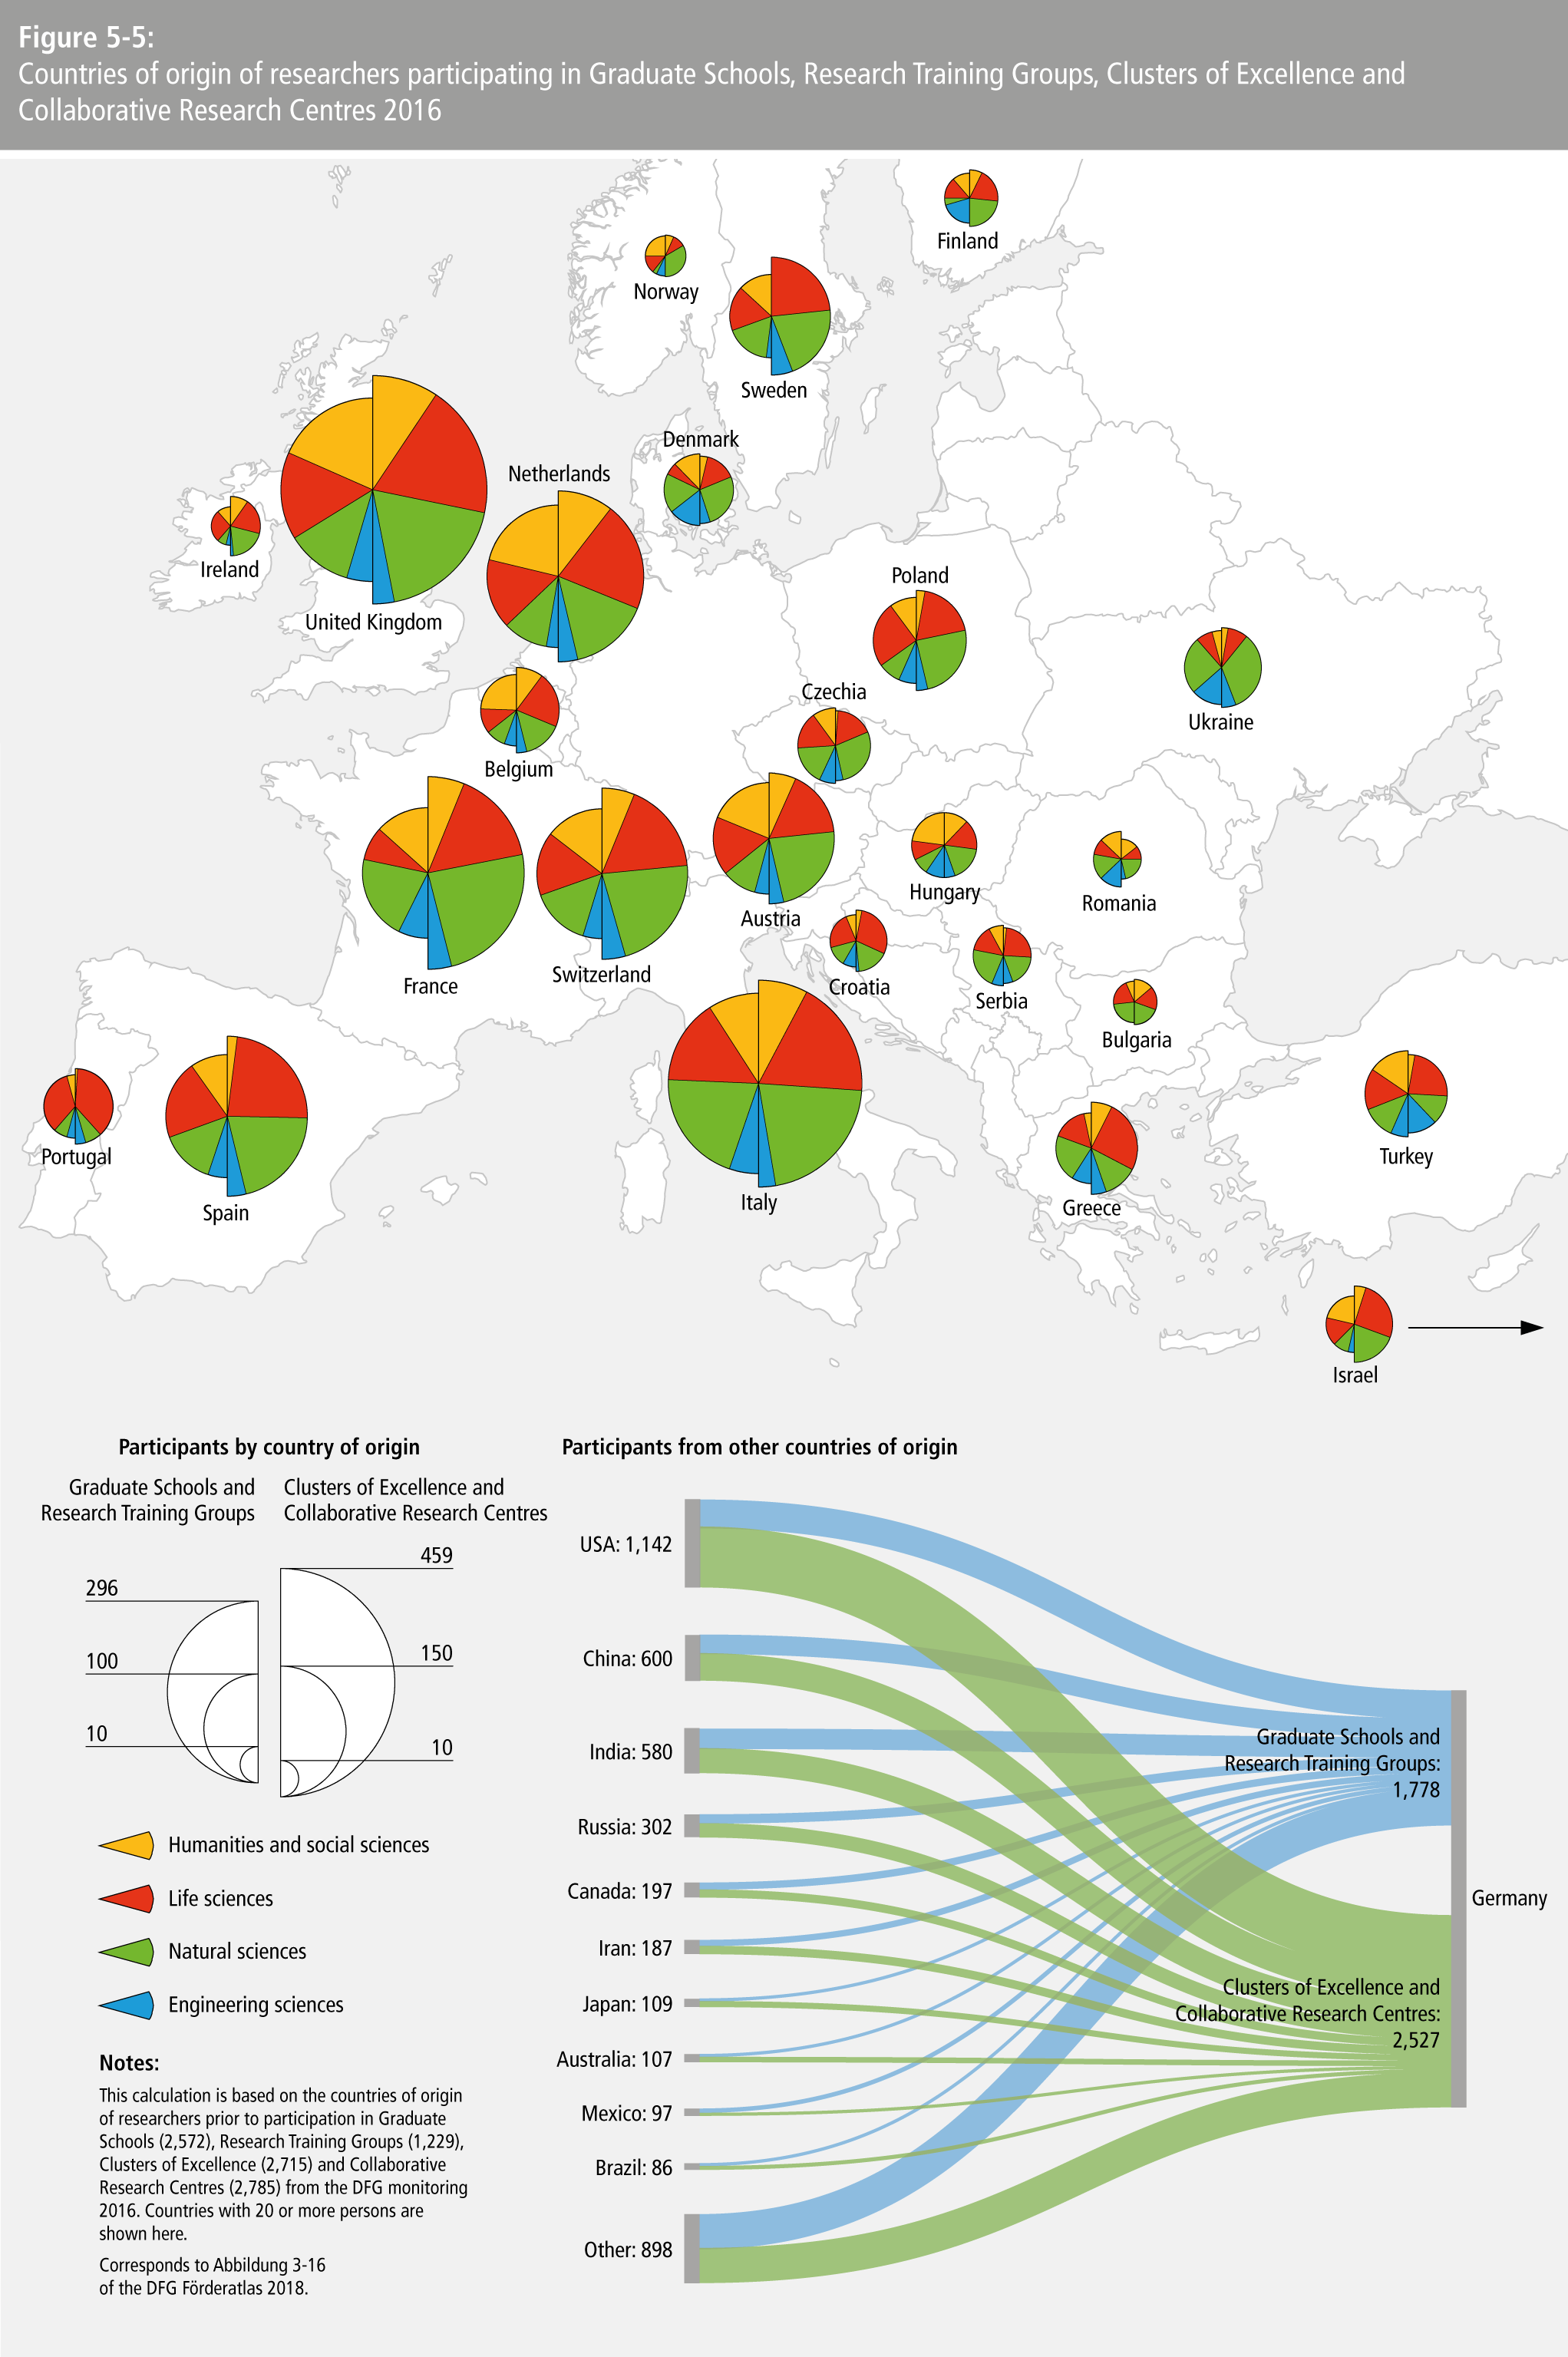
- Figure 5-5: Countries of origin of researchers participating in Graduate Schools, Research Training Groups, Clusters of Excellence and Collaborative Research Centres 201
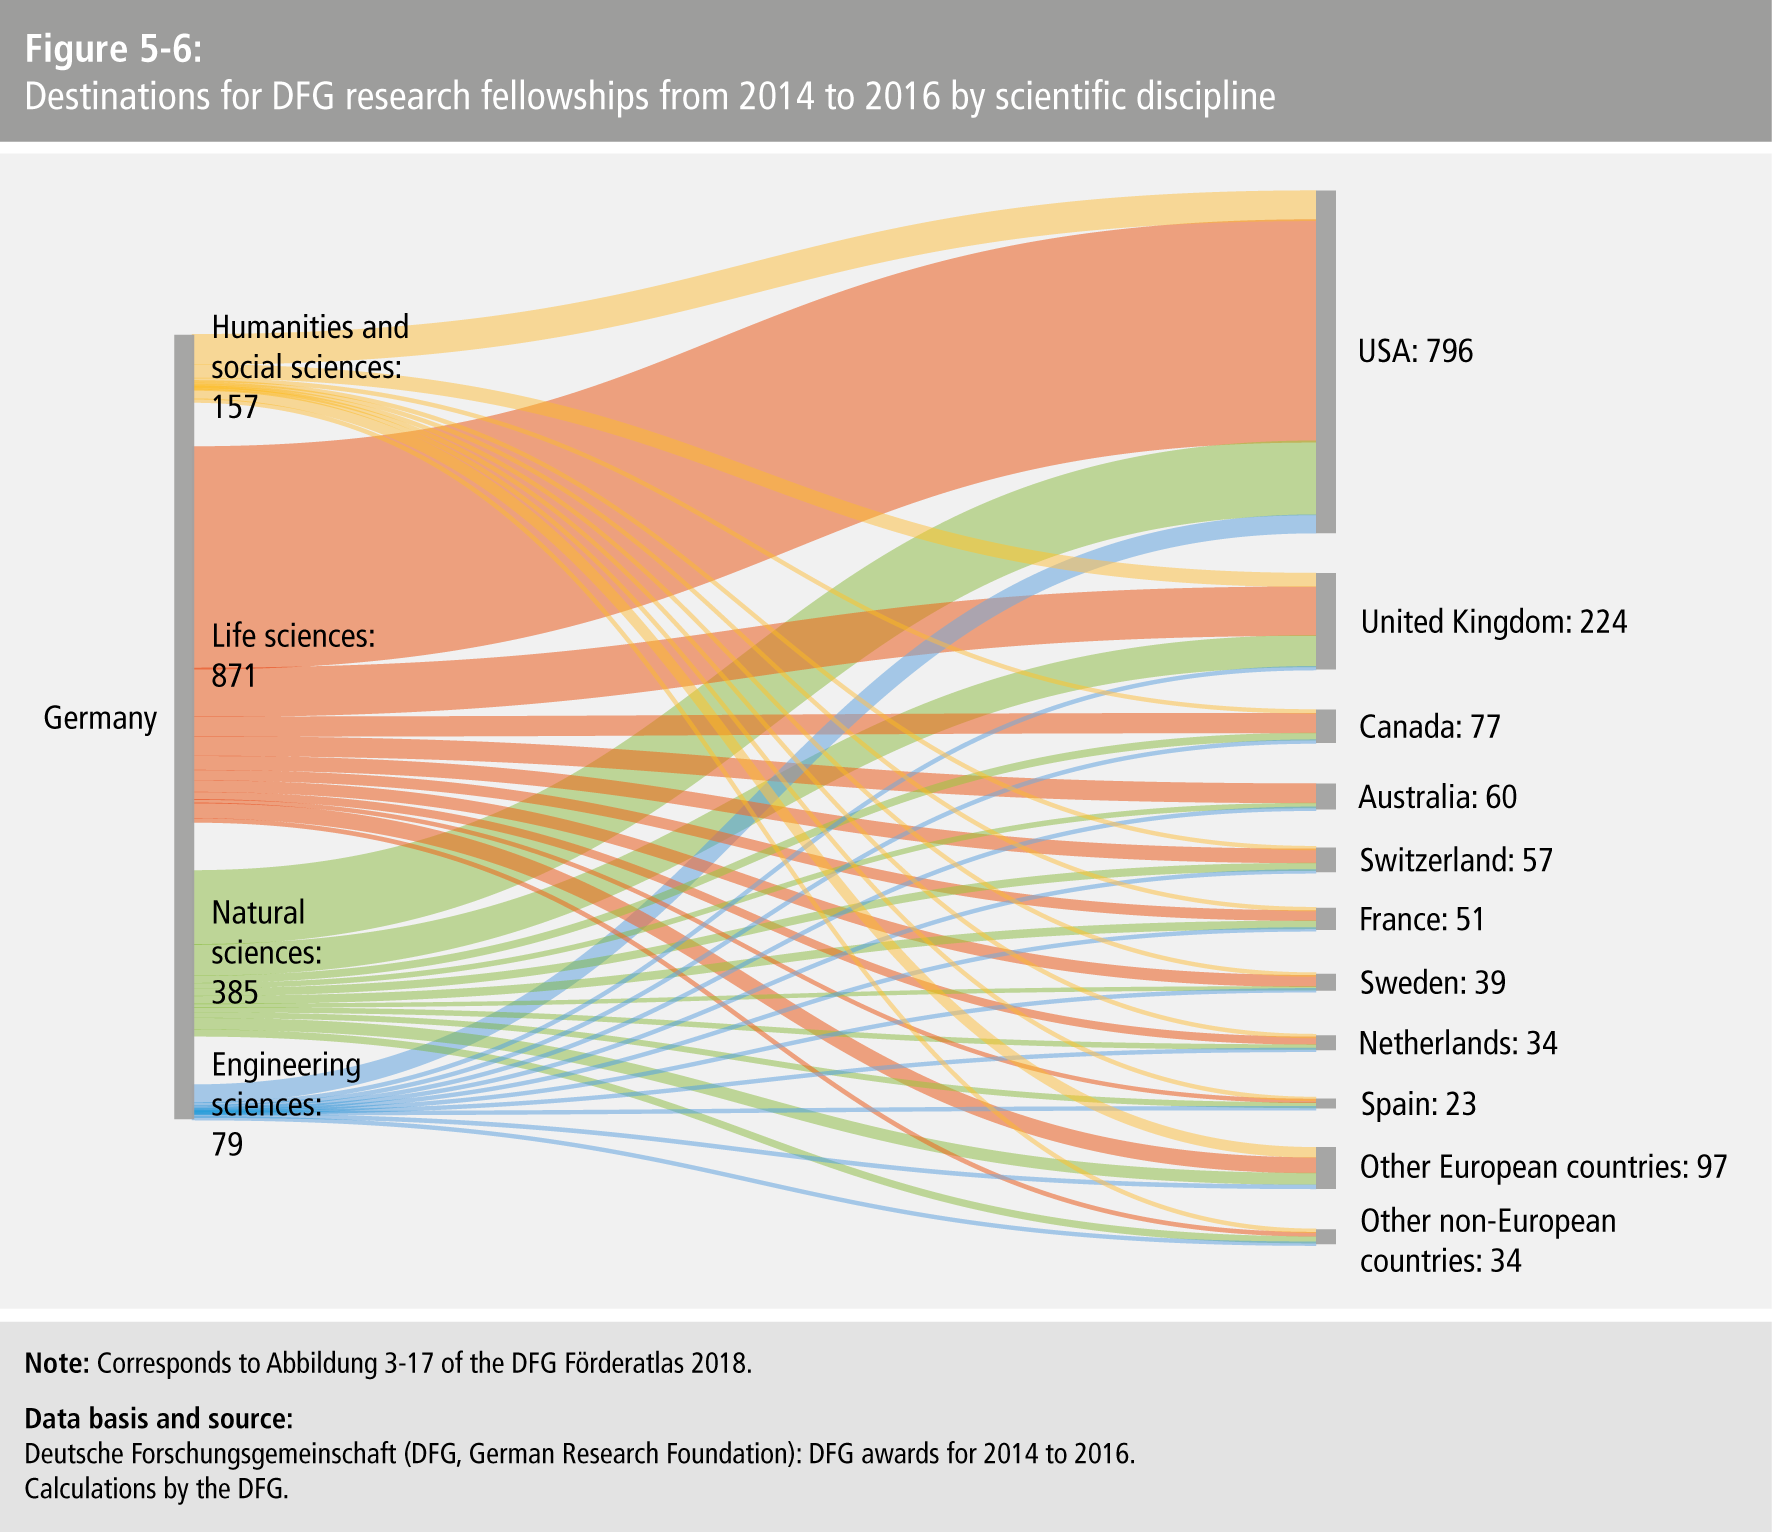
- Figure 5-6: Destinations for DFG research fellowships from 2014 to 2016 by scientific disciplin
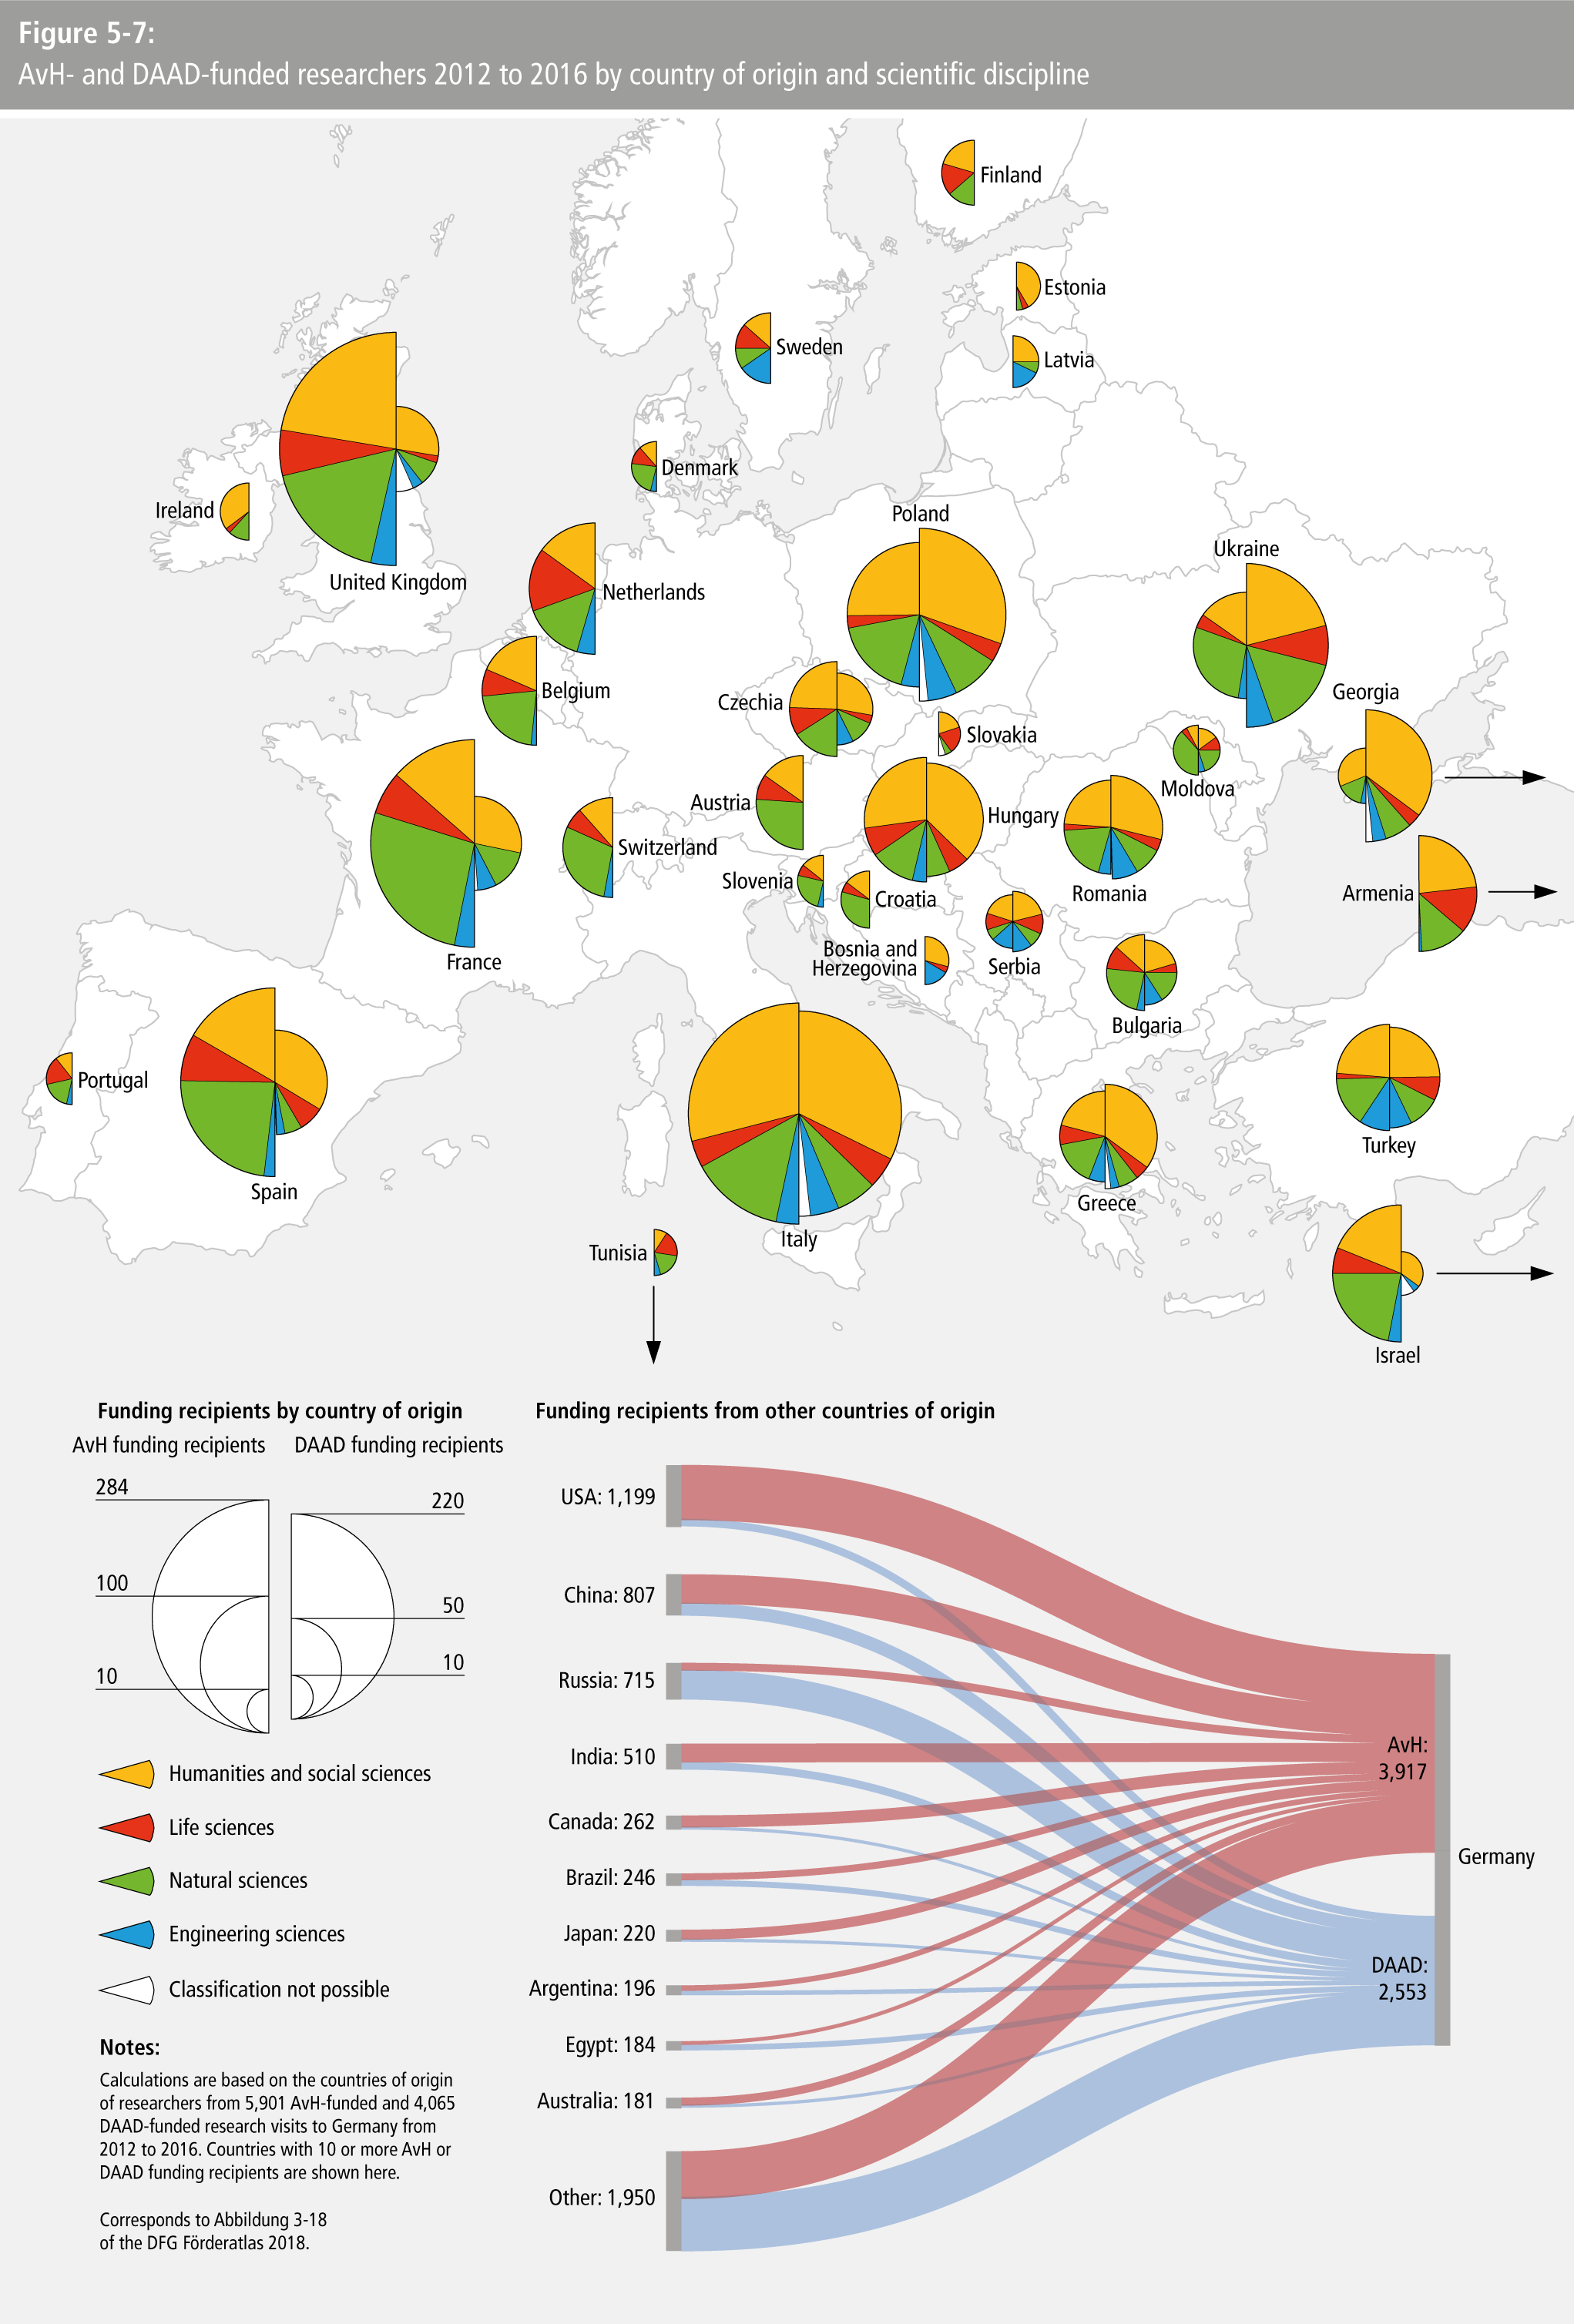
- Figure 5-7: AvH- and DAAD-funded researchers 2012 to 2016 by country of origin and scientific disciplin
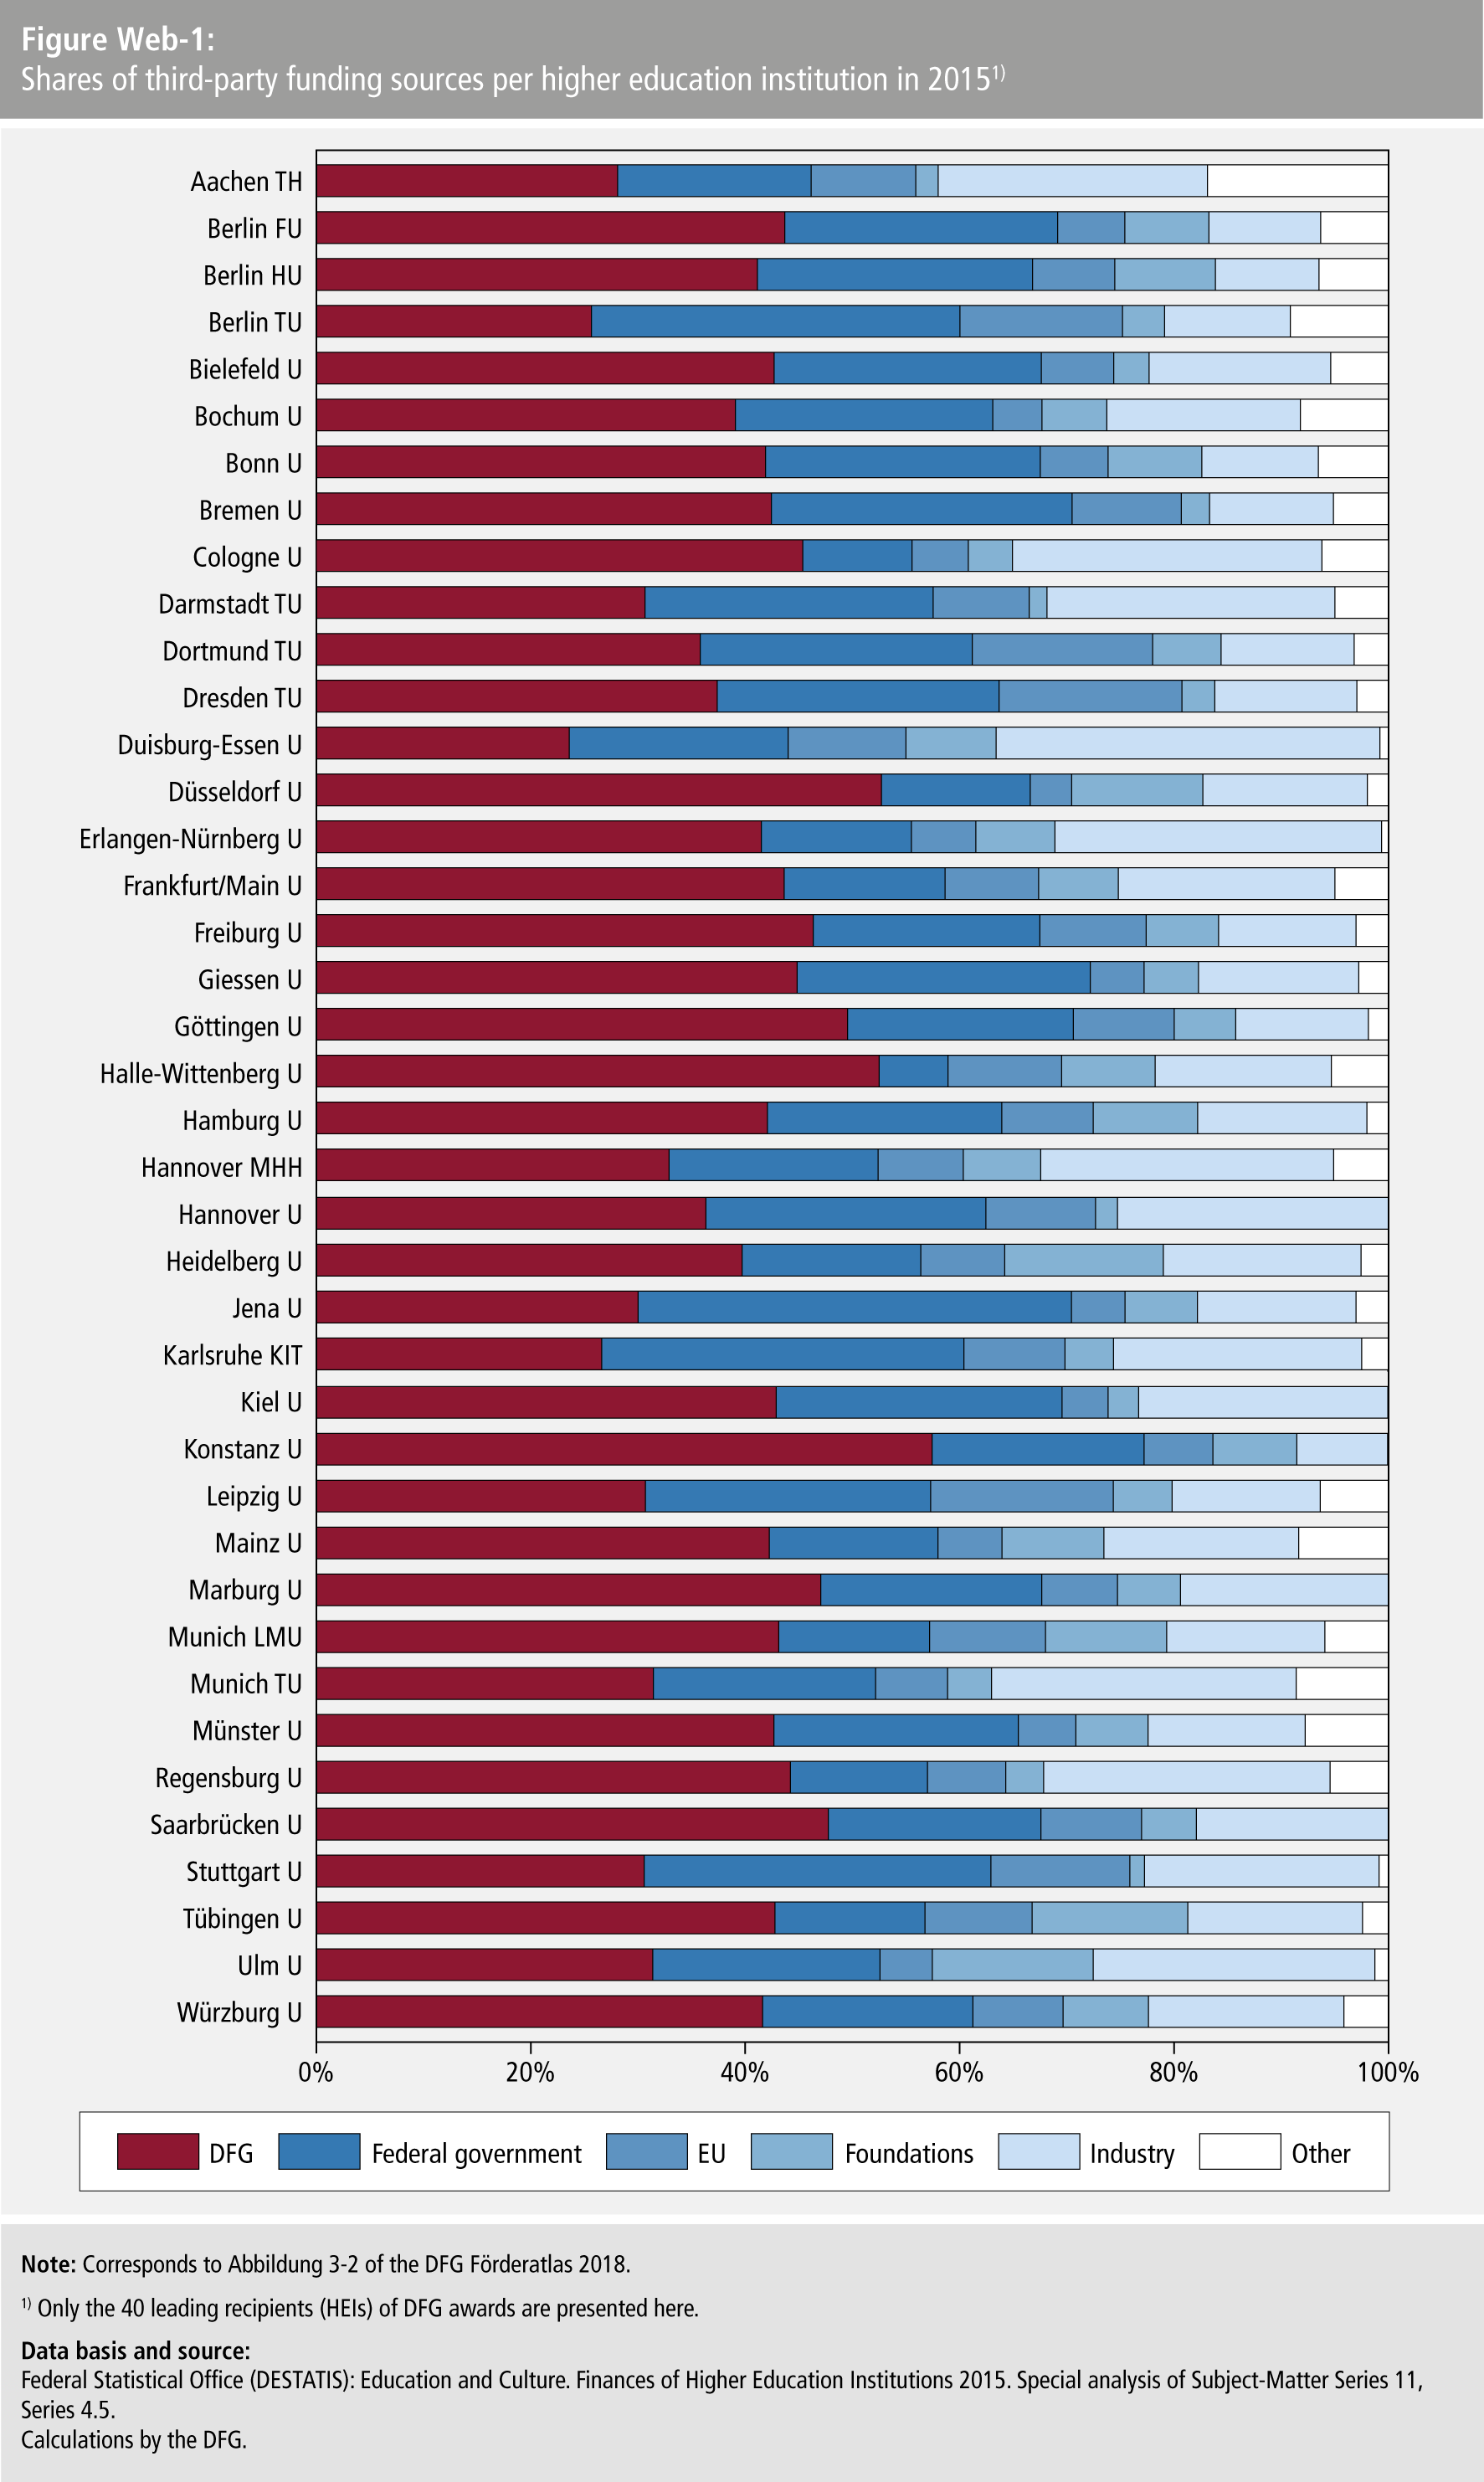
- Figure Web-1: Shares of third-party funding sources per higher education institution in 201
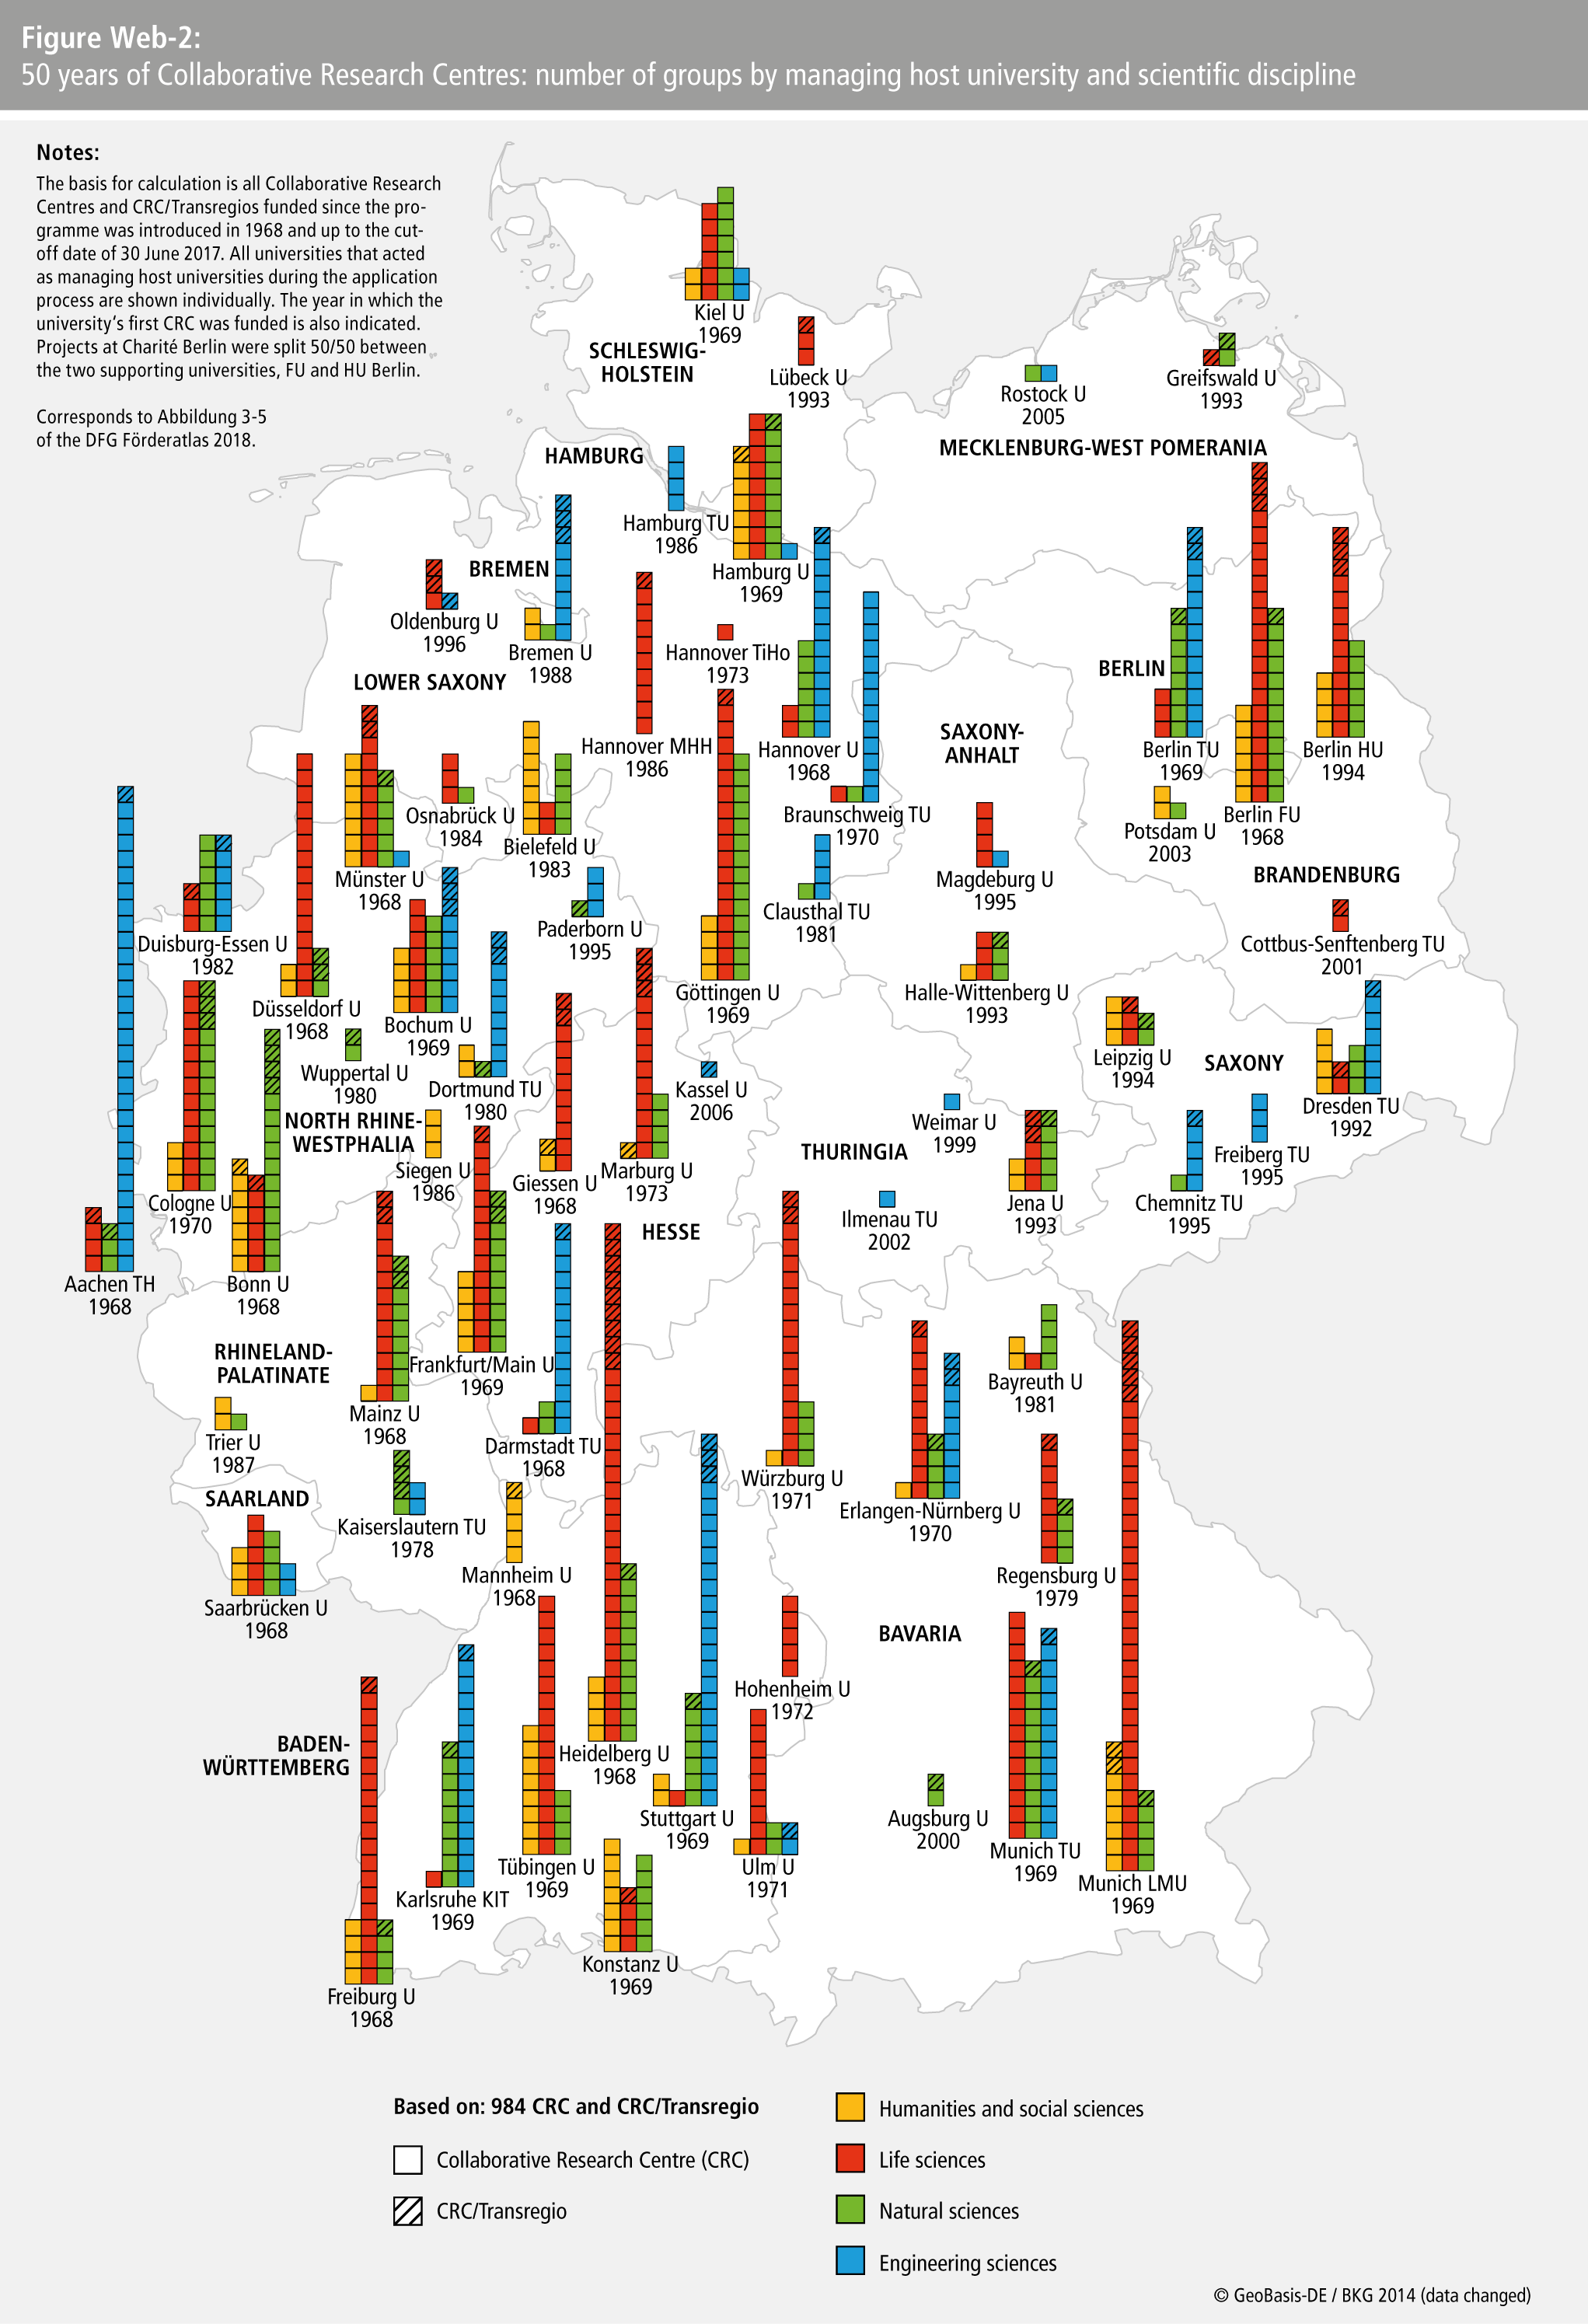
- Figure Web-2: 50 years of Collaborative Research Centres: number of groups by managing host university and scientific disciplin
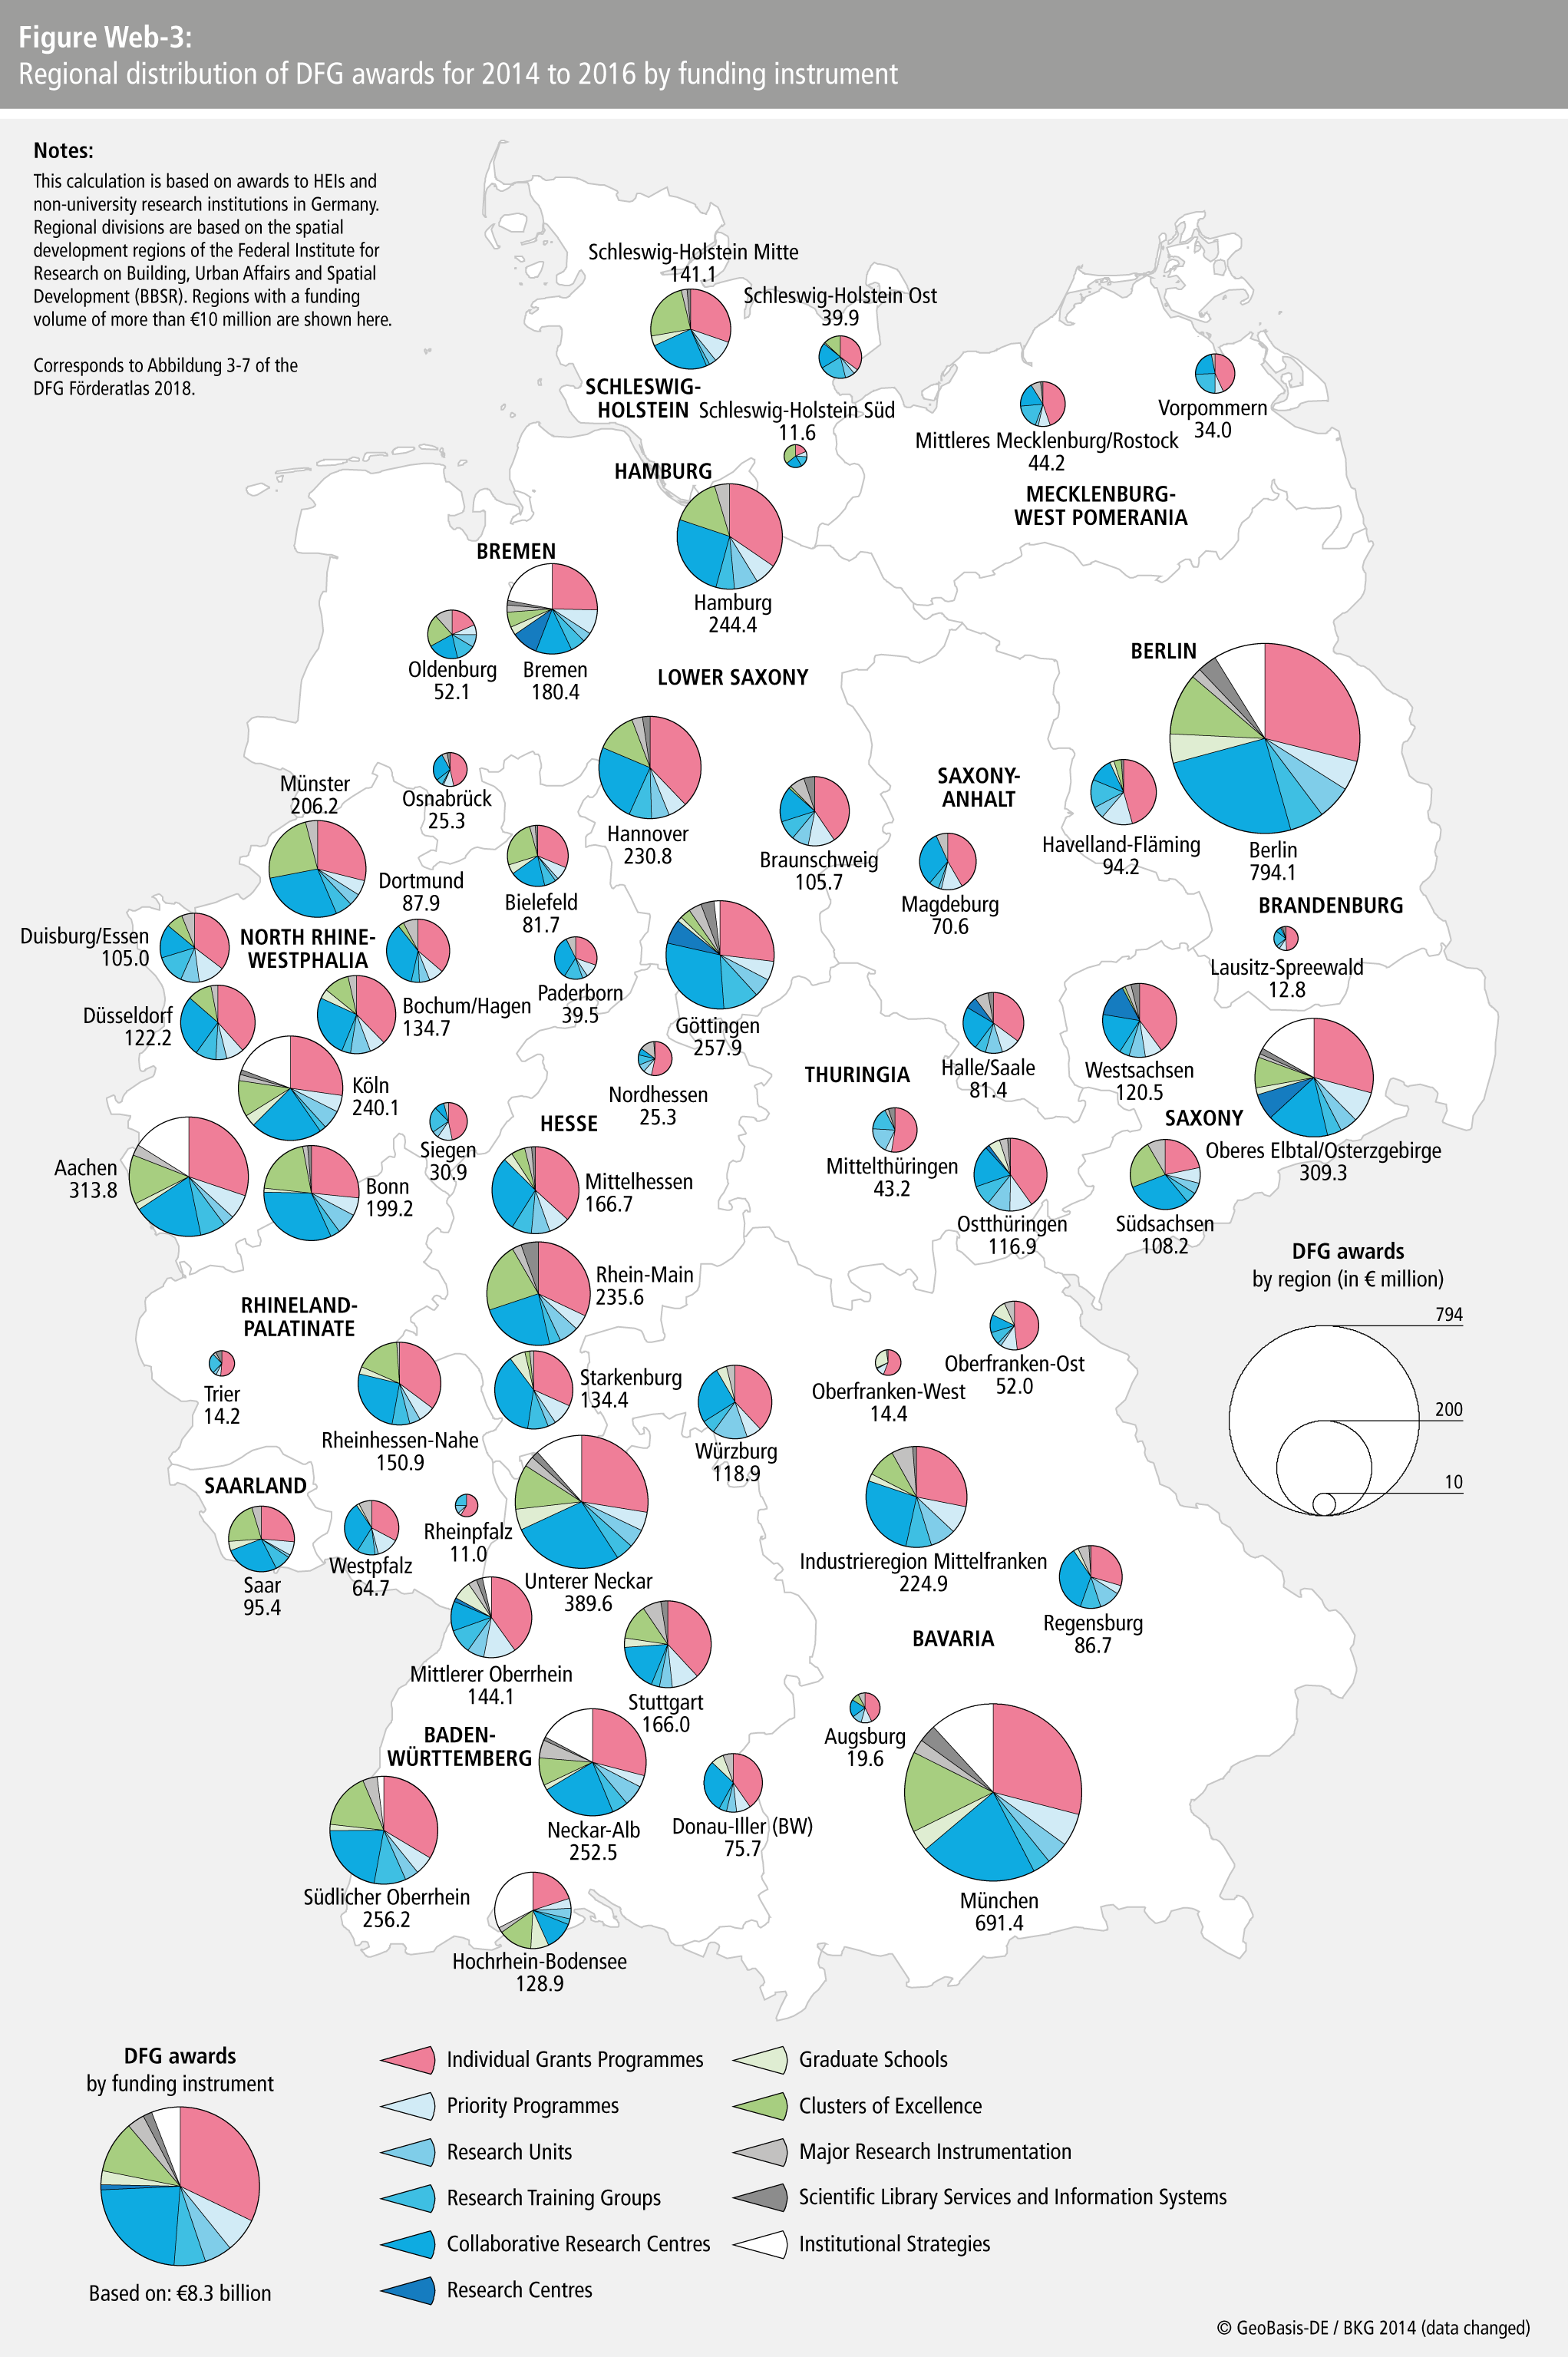
- Figure Web-3: Regional distribution of DFG awards for 2014 to 2016 by funding instrumen
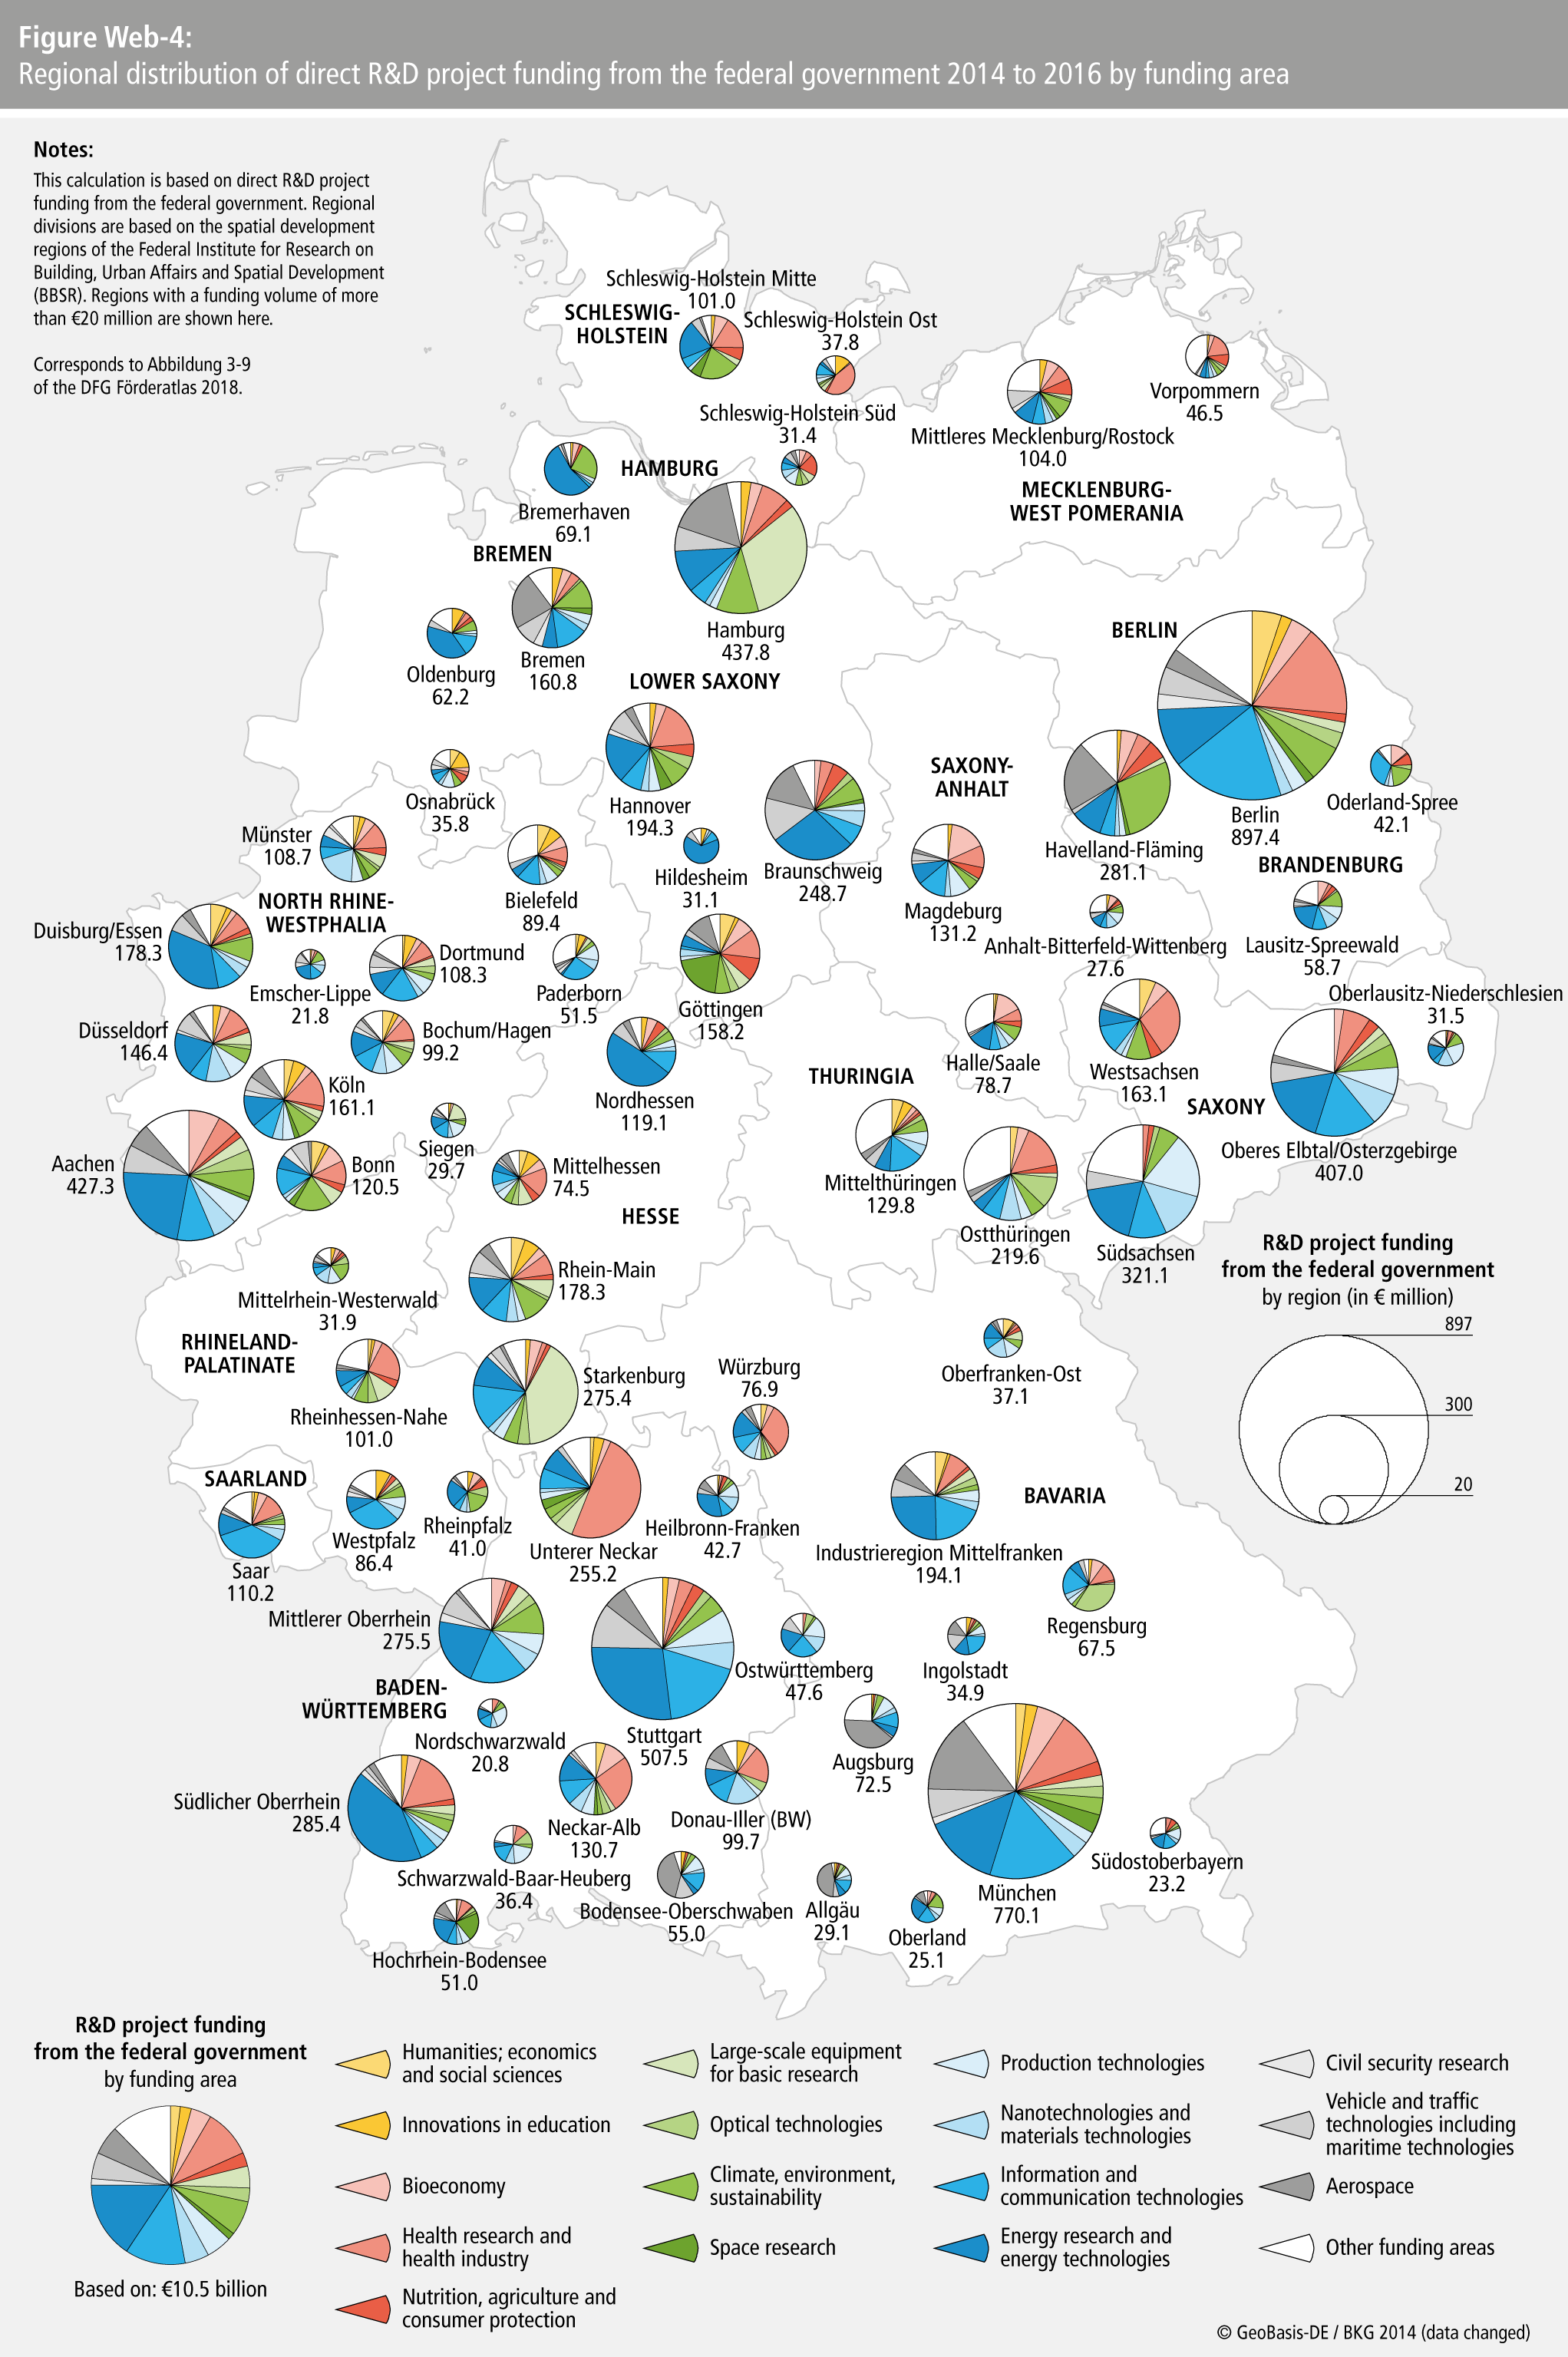
- Figure Web-4: Regional distribution of direct R&D project funding from the federal government 2014 to 2016 by funding are
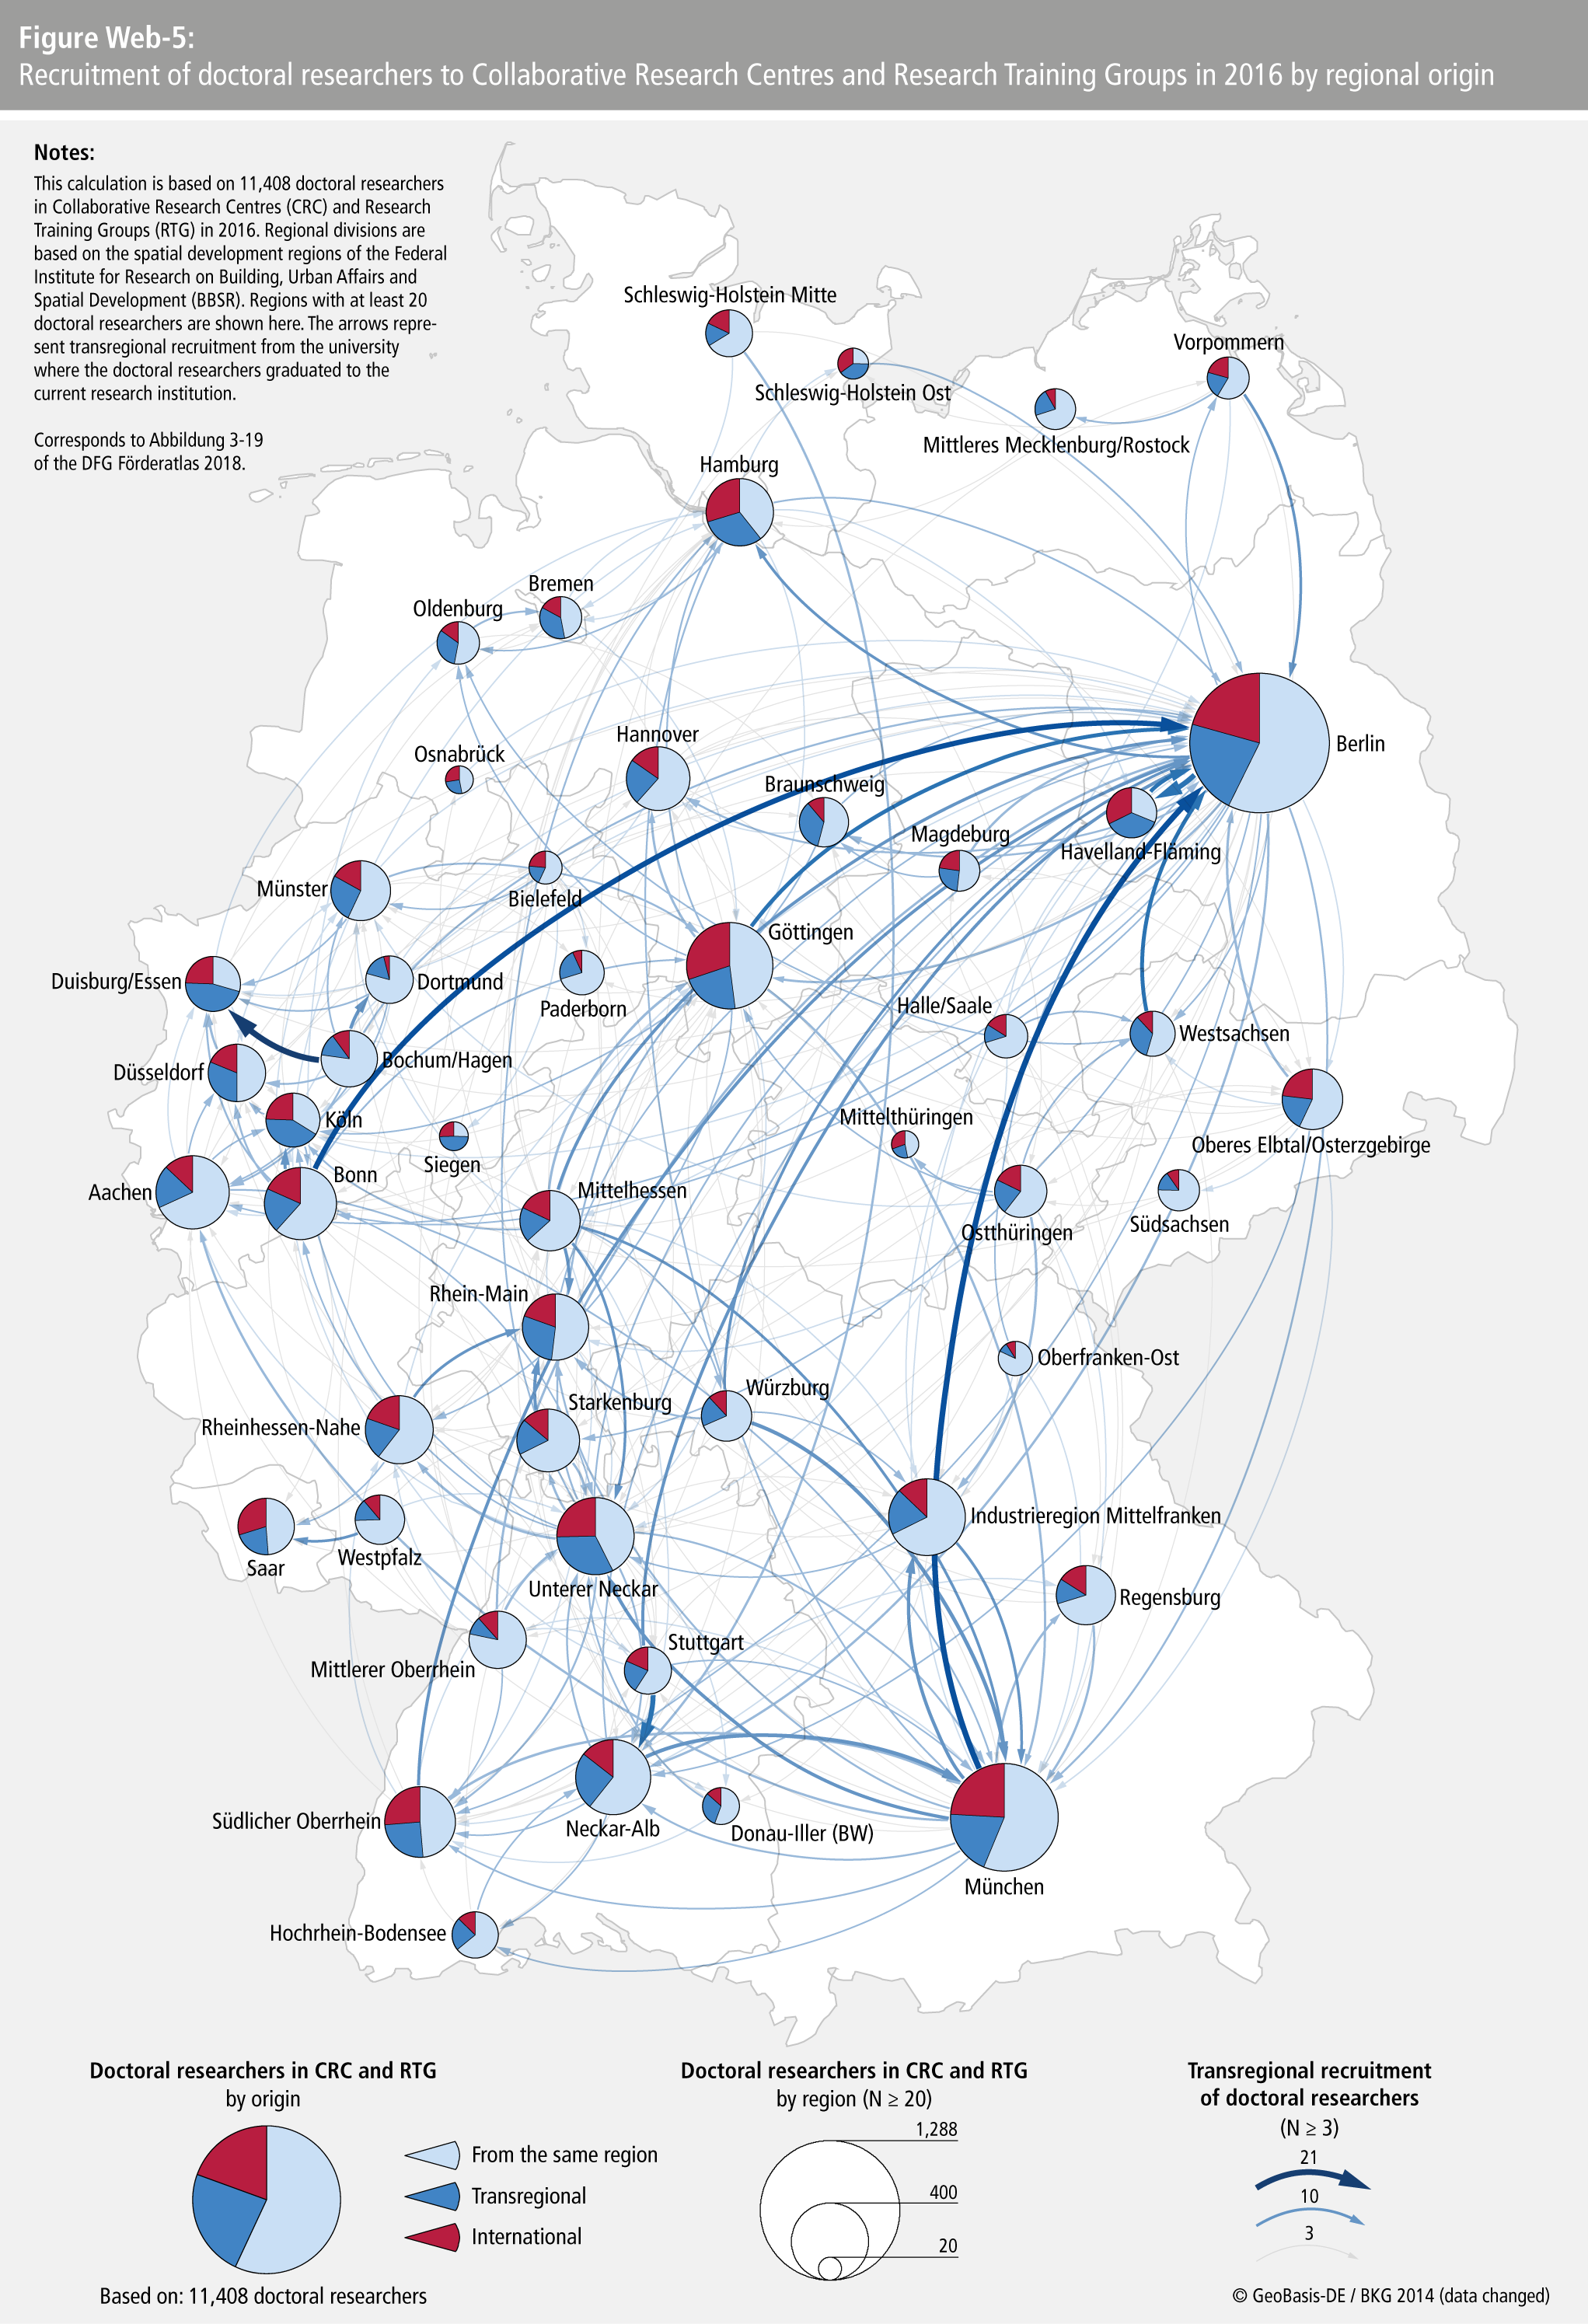
- Figure Web-5: Recruitment of doctoral researchers to Collaborative Research Centres and Research Training Groups in 2016 by regional origi
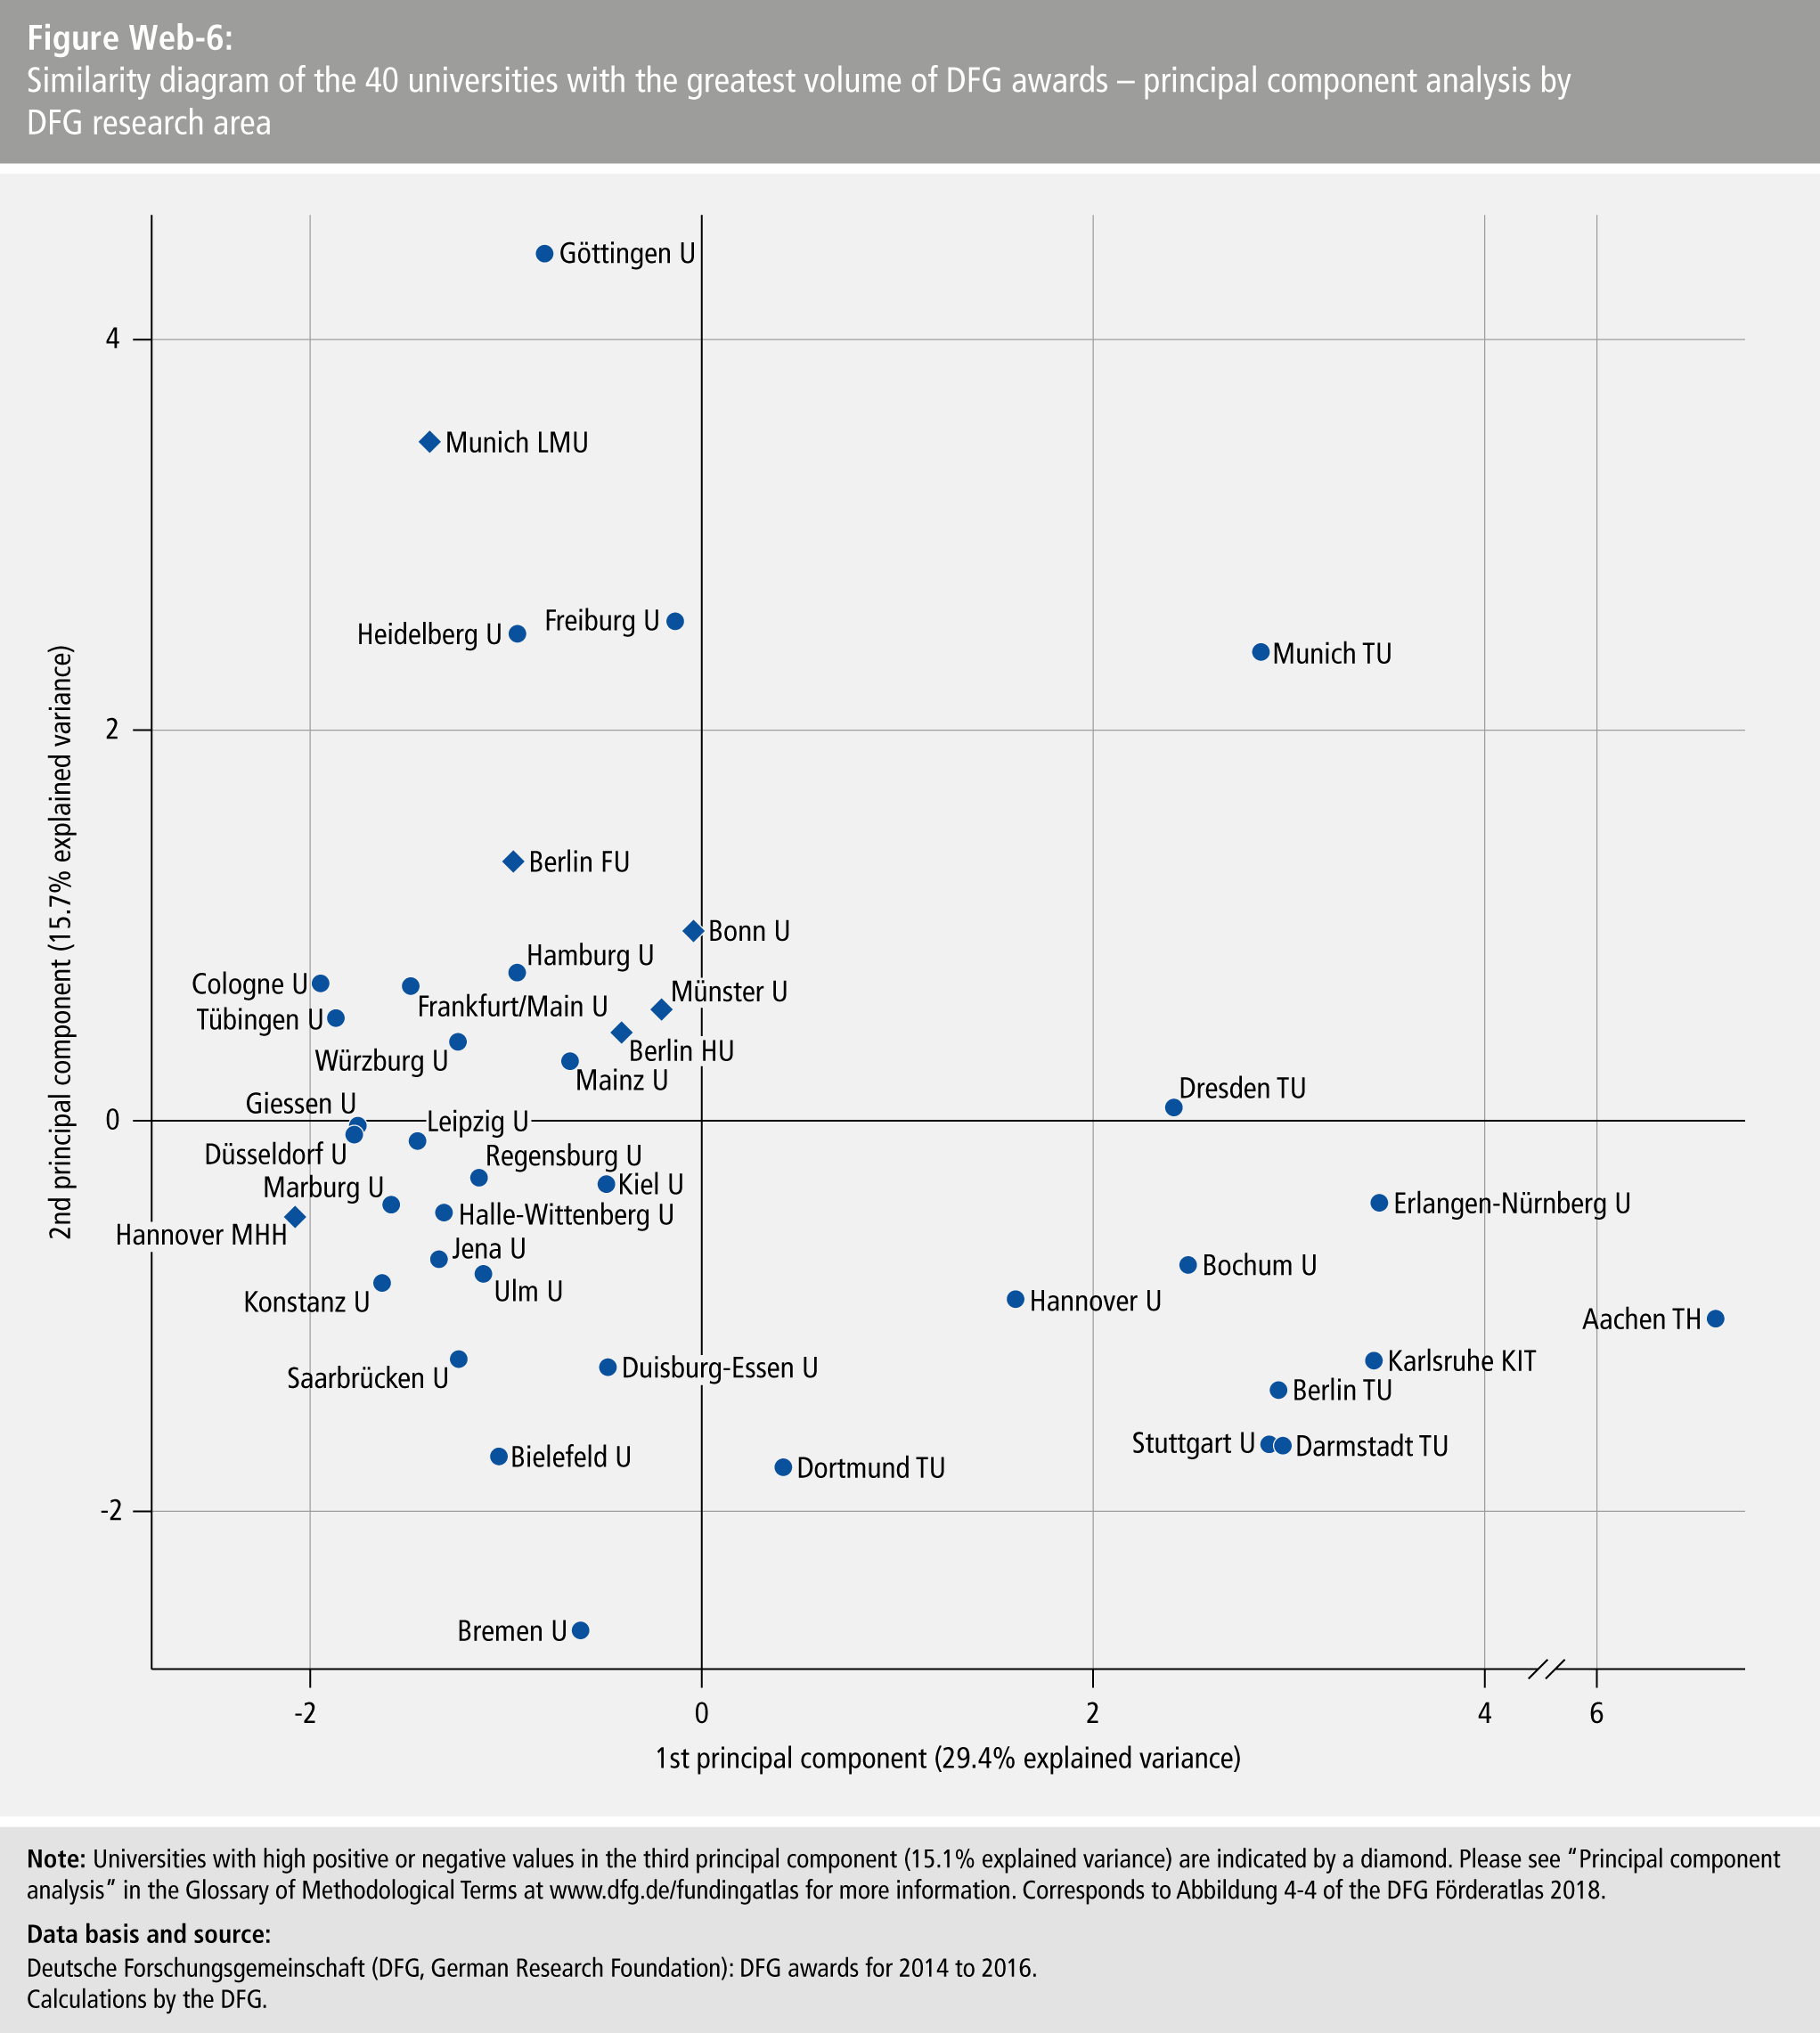
- Figure Web-6: Similarity diagram of the 40 universities with the greatest volume of DFG awards – principal component analysis by DFG research are
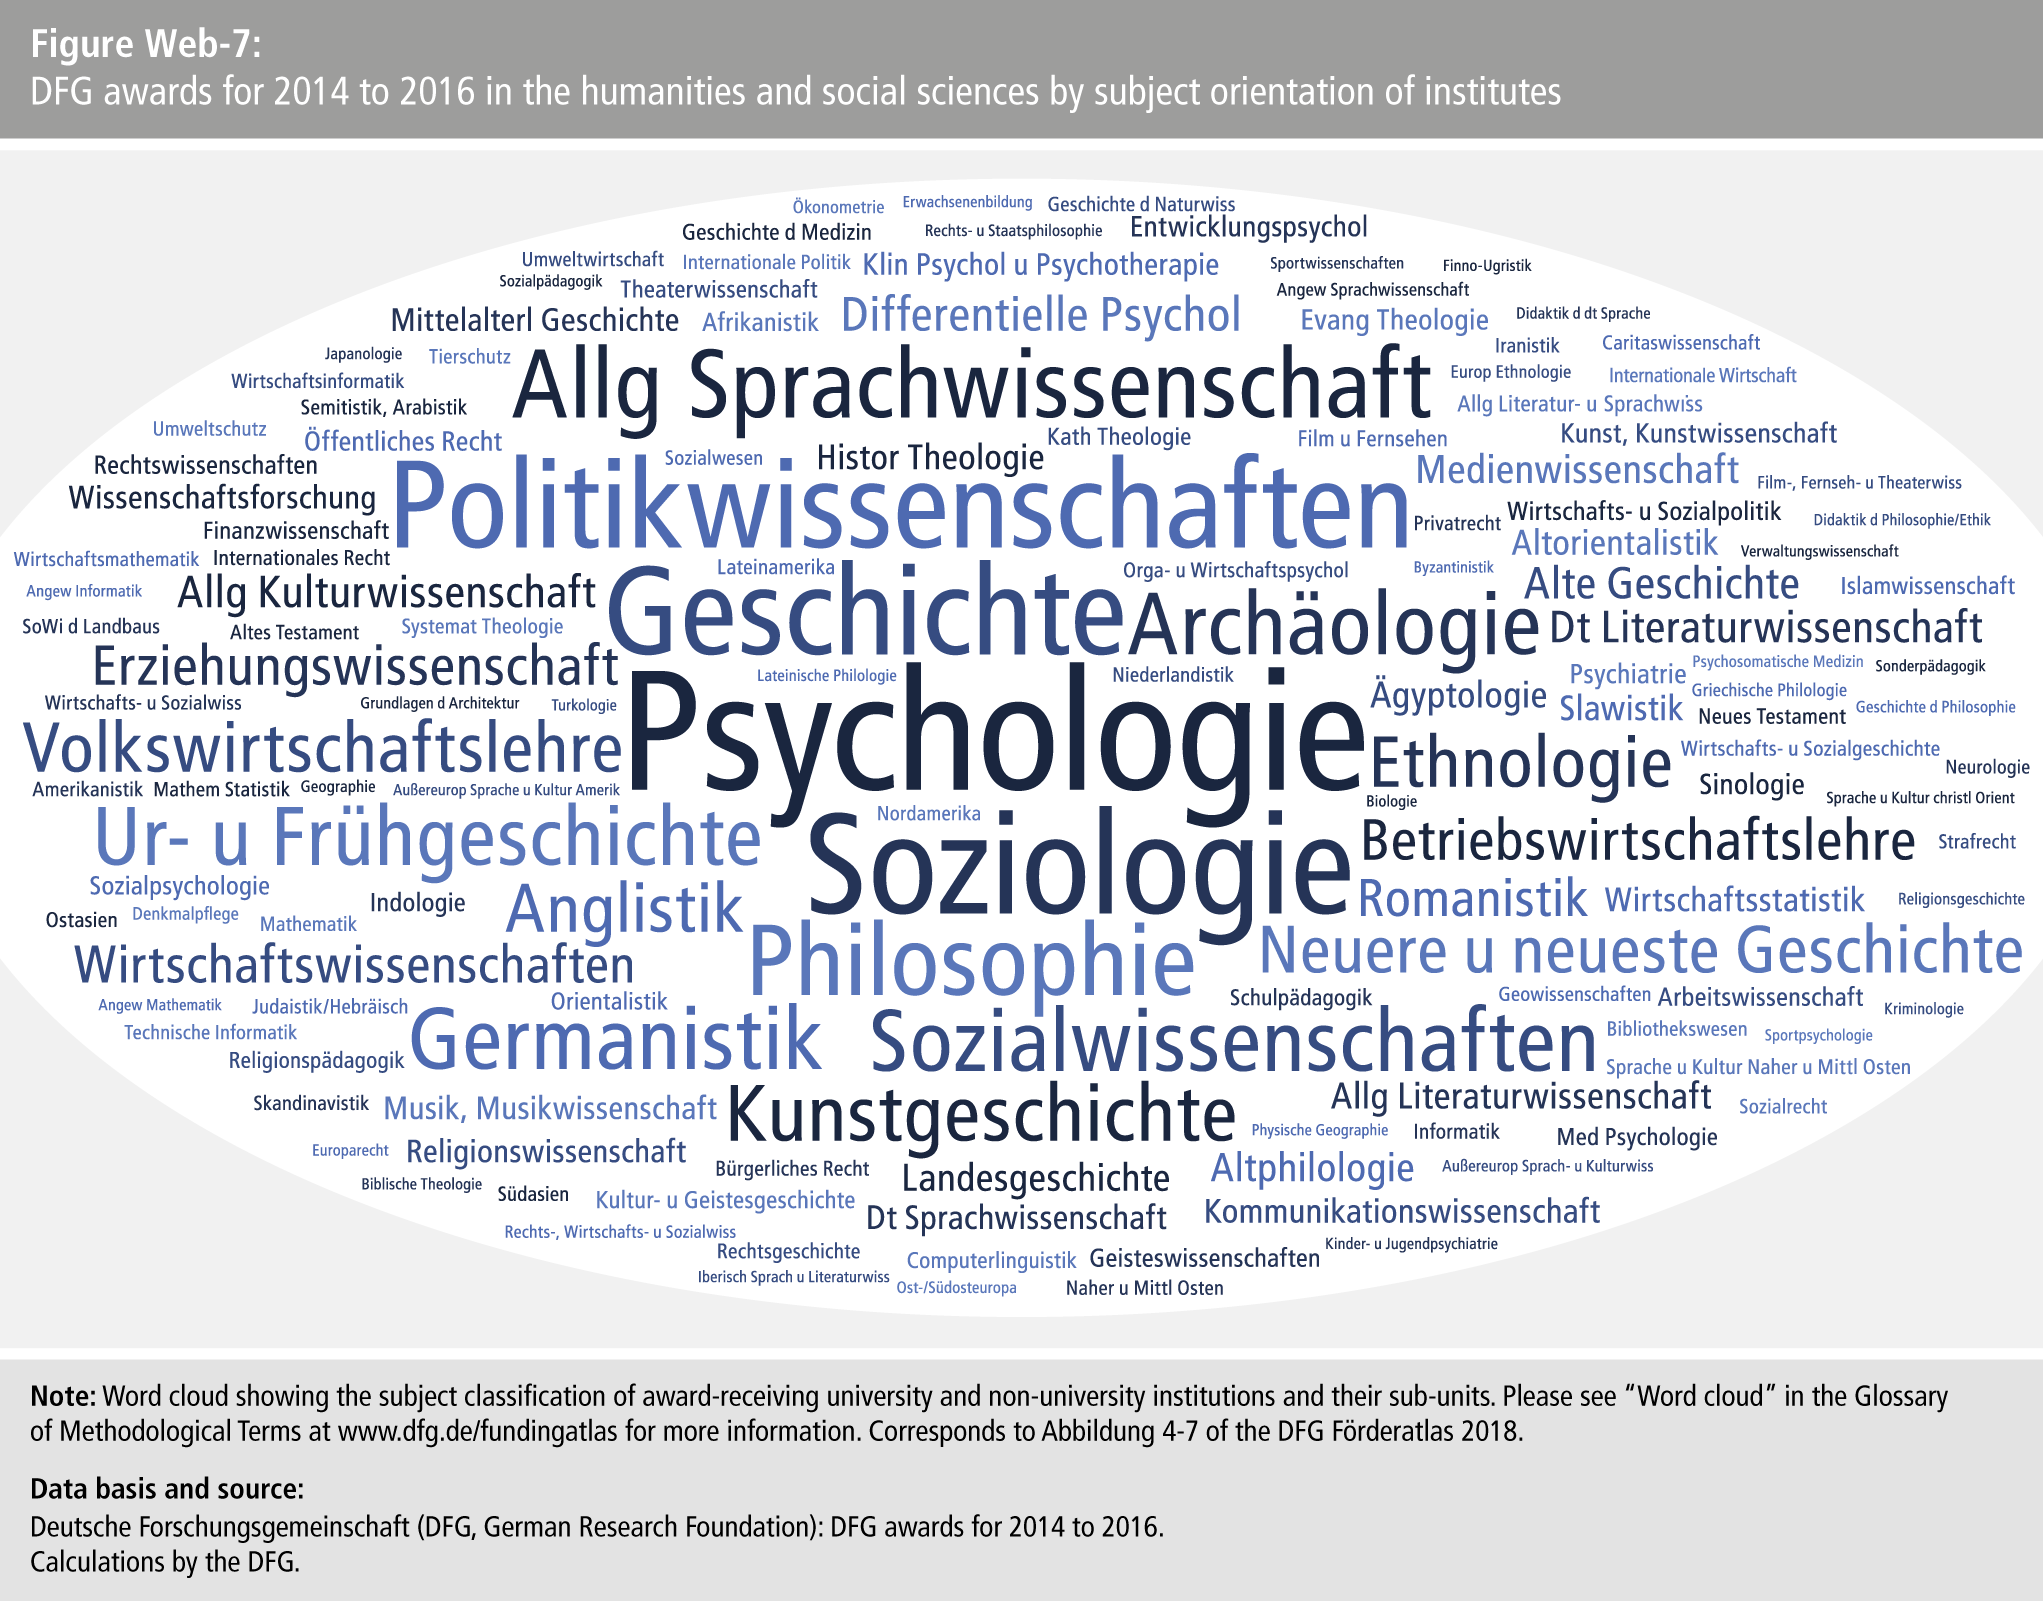
- Figure Web-7: DFG awards for 2014 to 2016 in the humanities and social sciences by subject orientation of institute
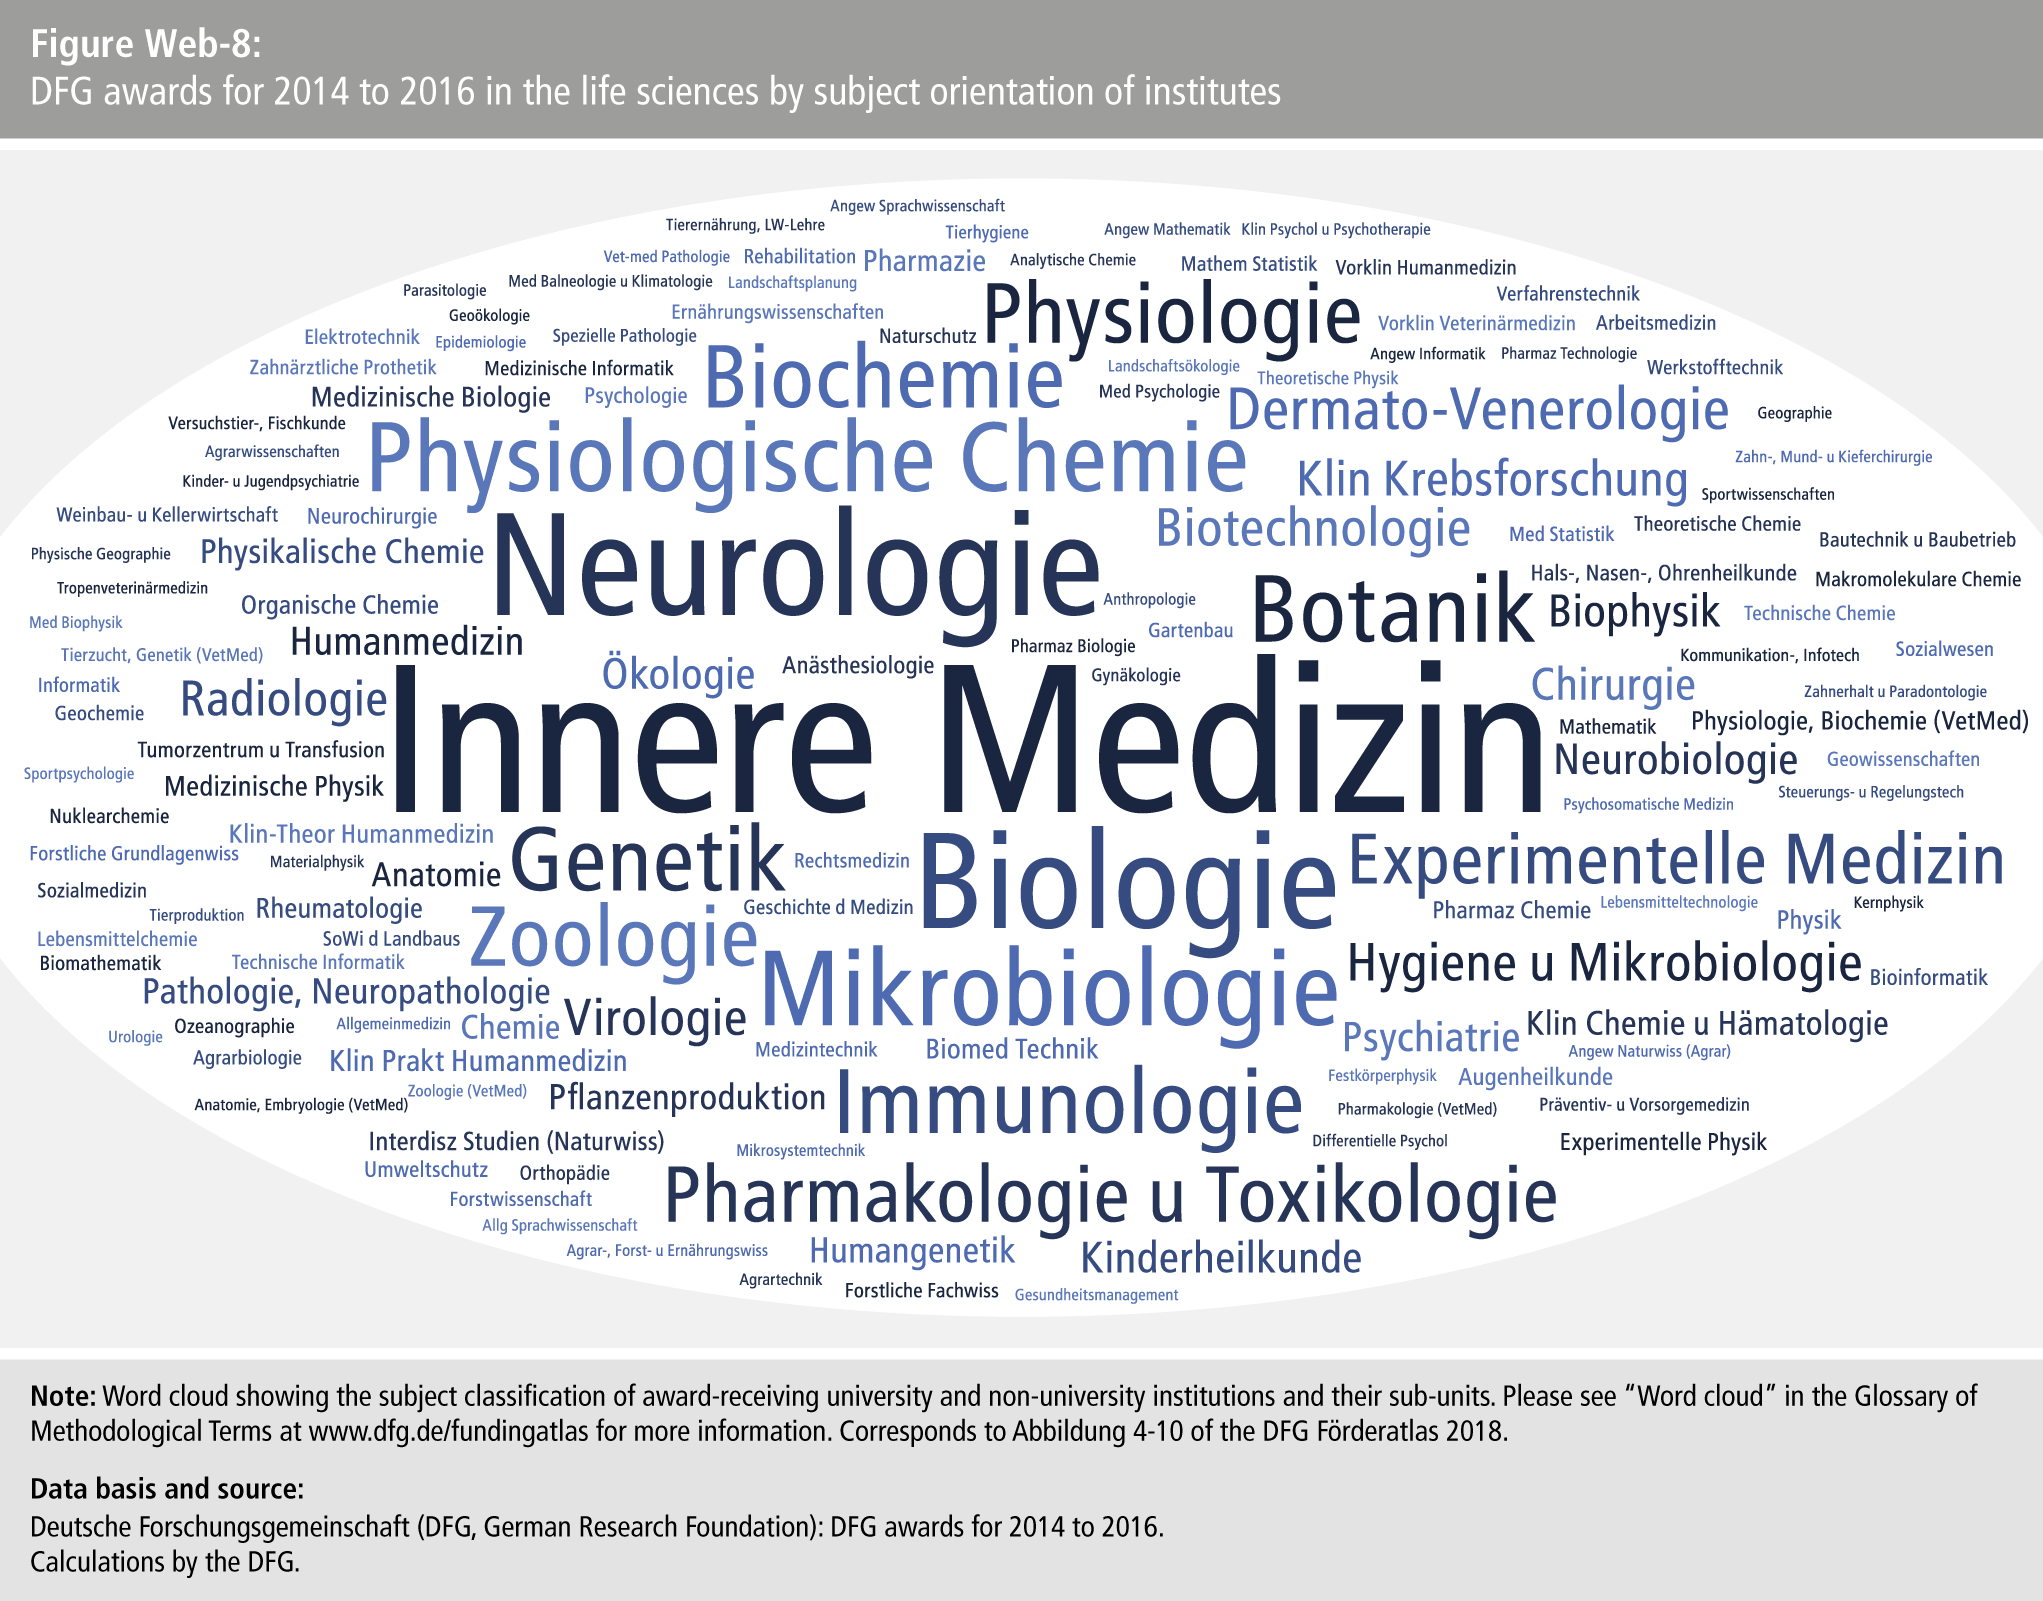
- Figure Web-8: DFG awards for 2014 to 2016 in the life sciences by subject orientation of institute
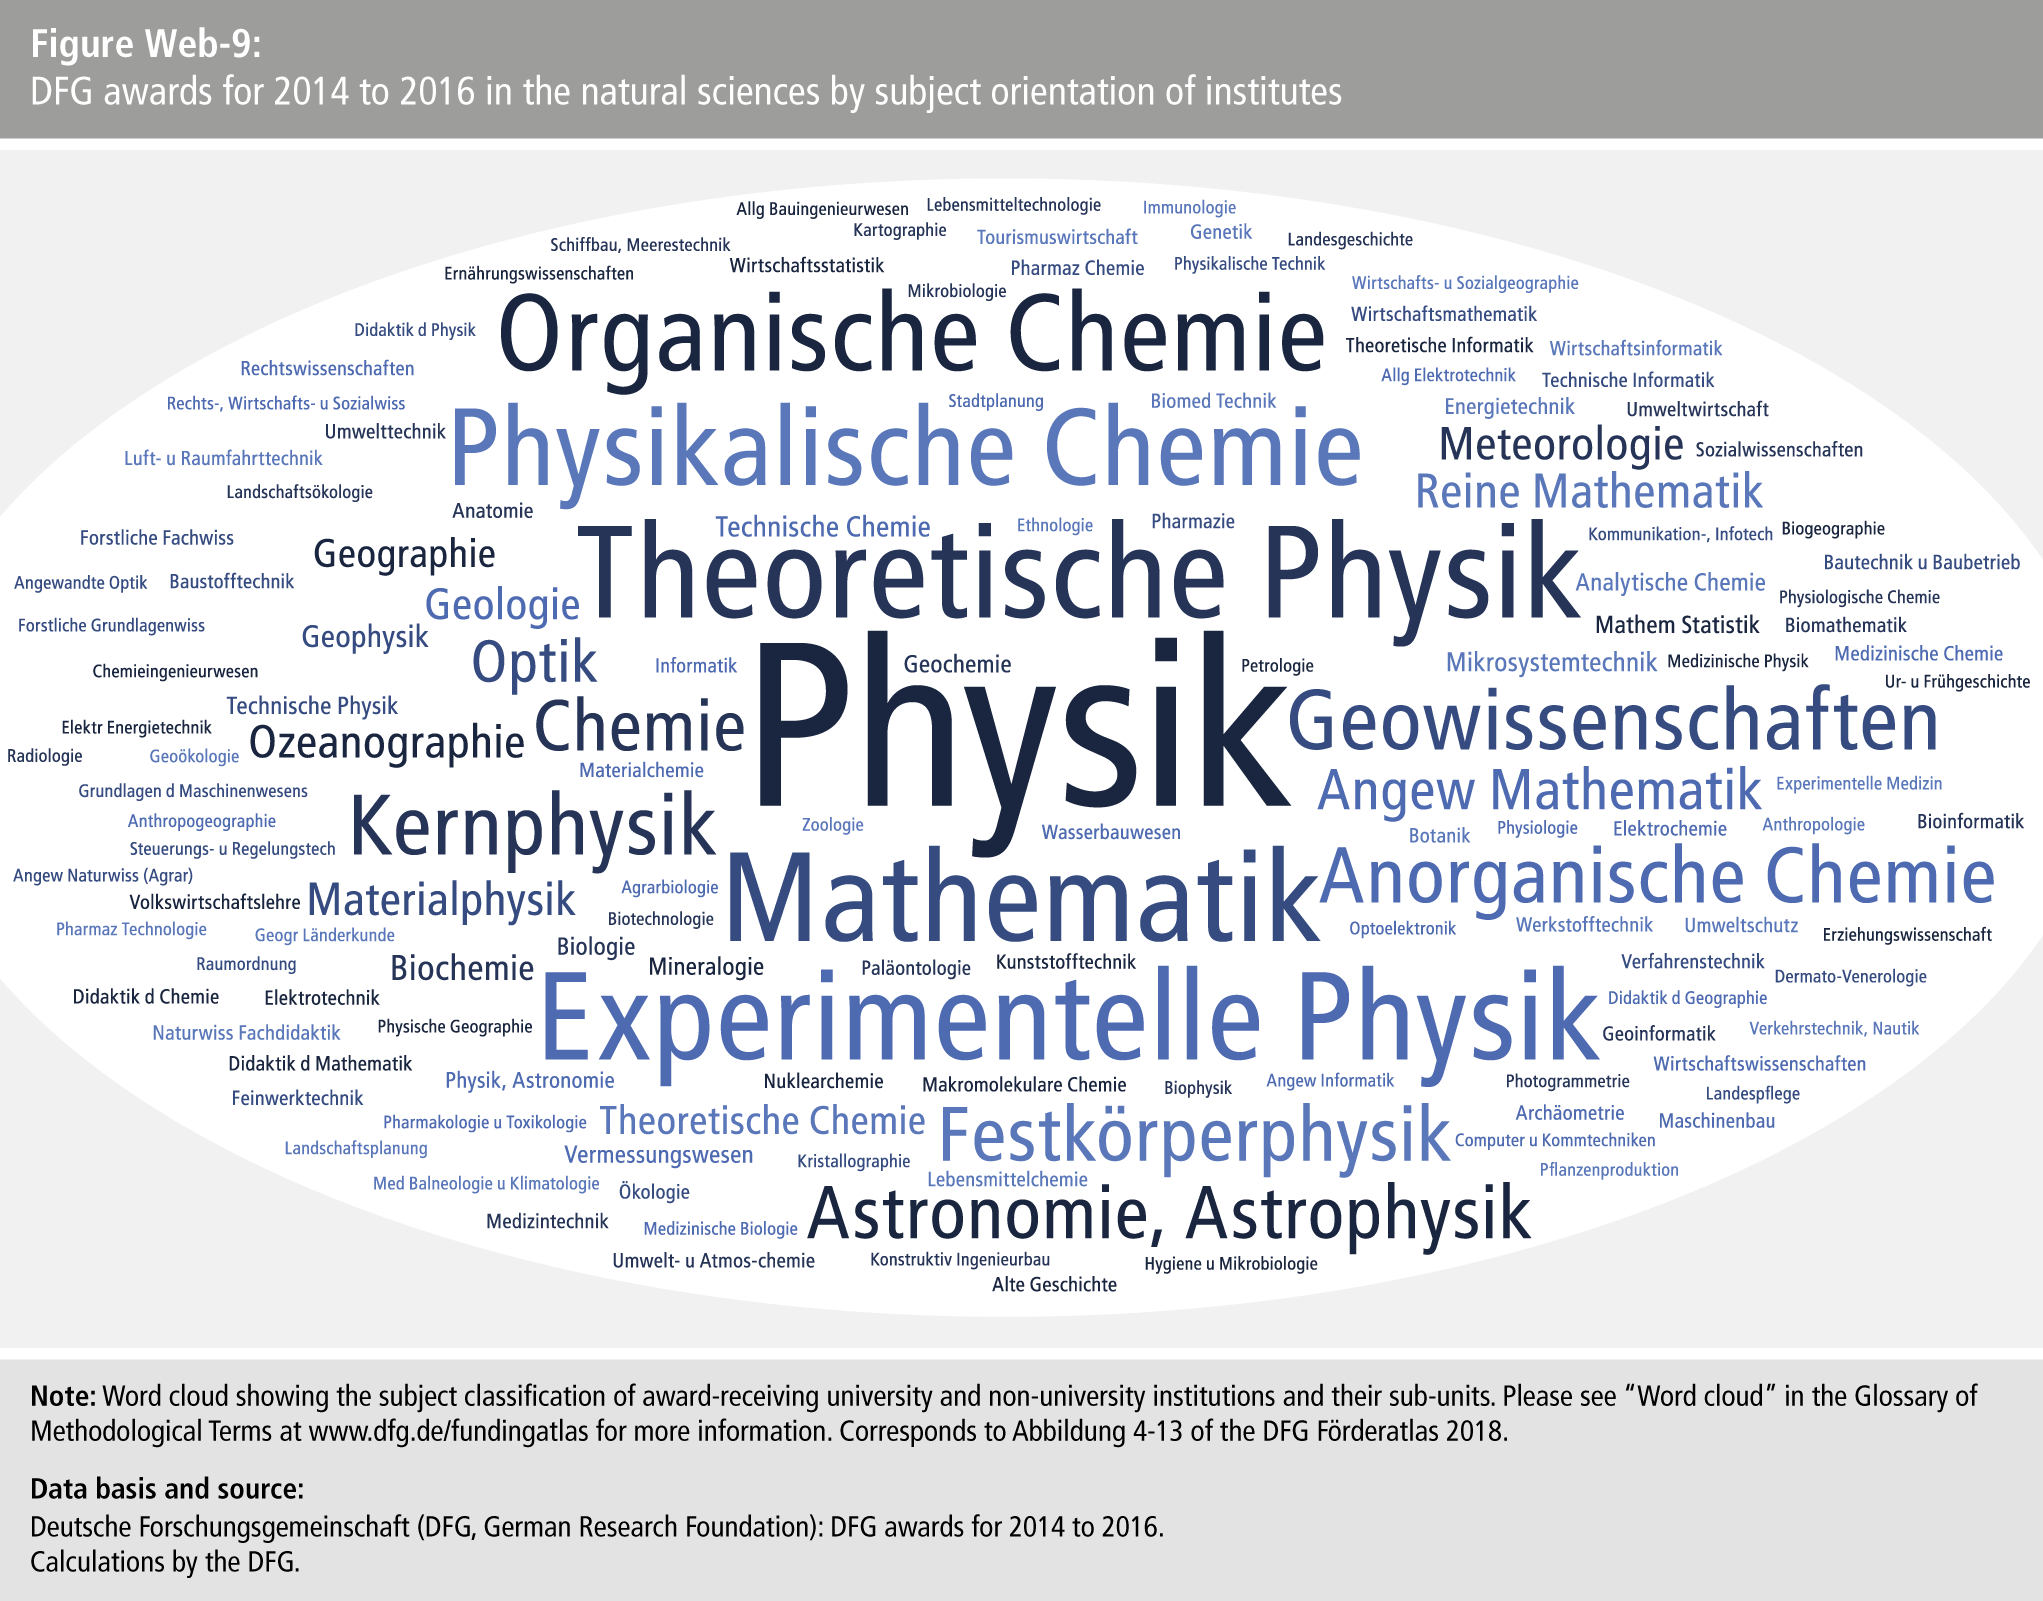
- Figure Web-9: DFG awards for 2014 to 2016 in the natural sciences by subject orientation of institute
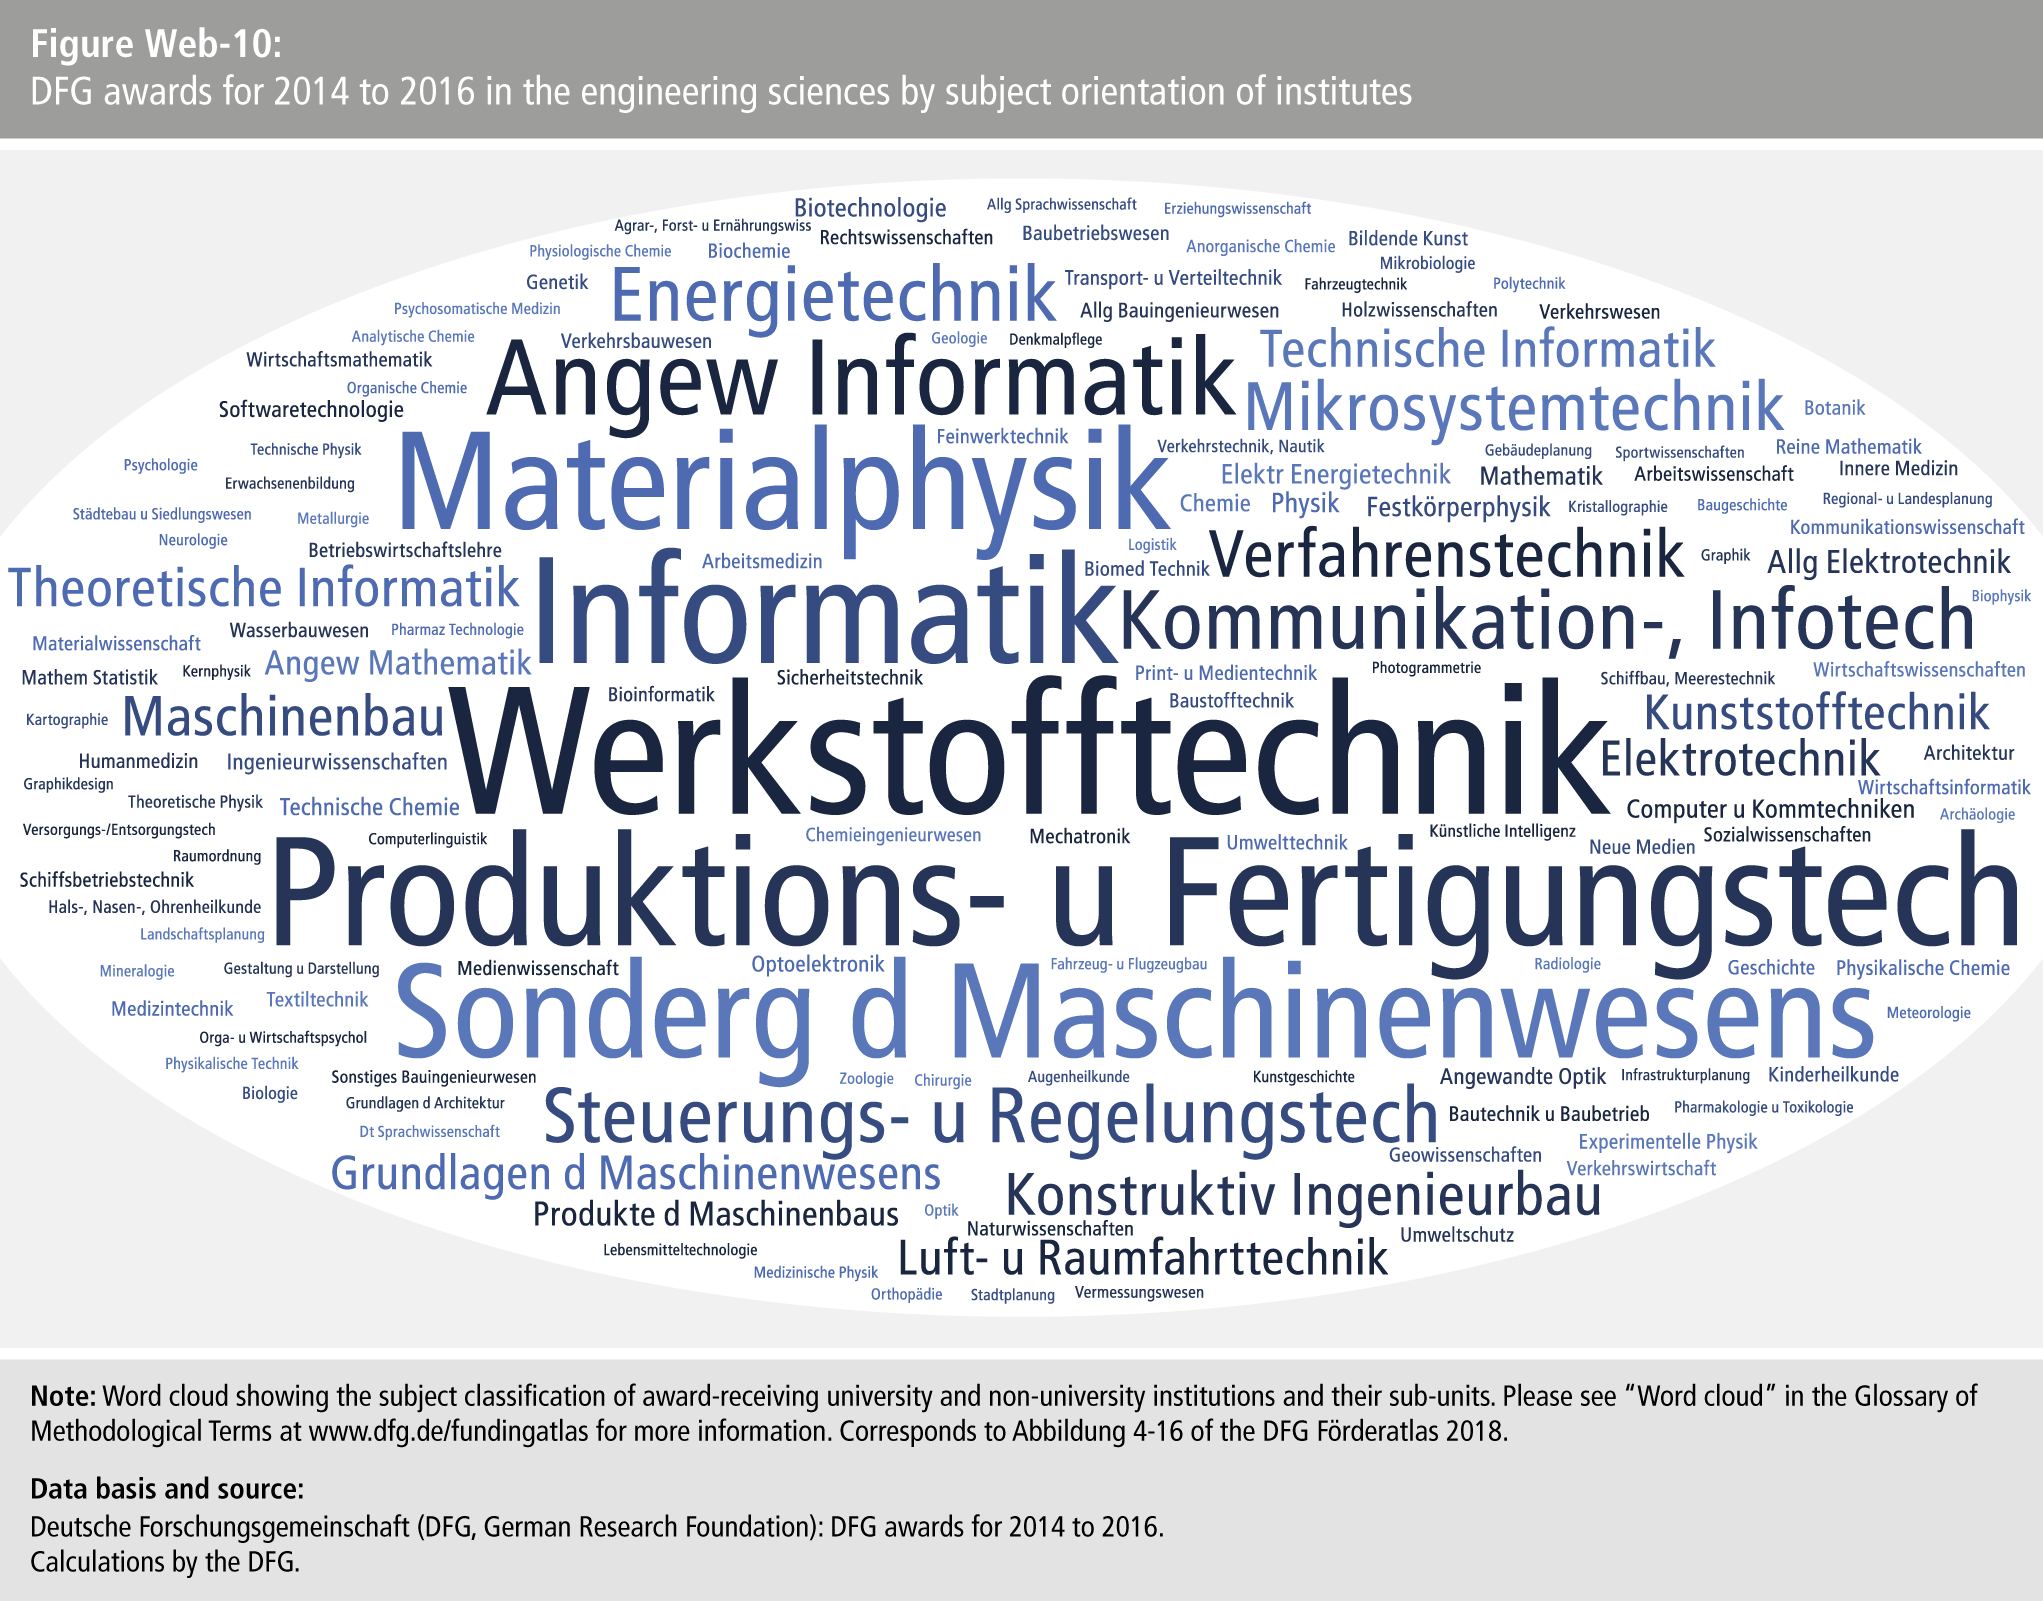
- Figure Web-10: DFG awards for 2014 to 2016 in the engineering sciences by subject orientation of institute
Contact
Dr. Jürgen Güdler
| E-mail: | Juergen.Guedler@dfg.de |
| Telephone: | +49 (228) 885-2649 |
Christian Fischer
| E-mail: | christian.fischer@dfg.de |
| Telephone: | +49 (228) 885-2589 |